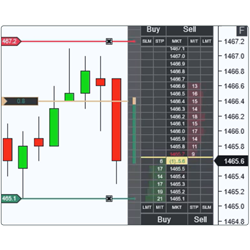
Chart trading at its best! A scalable Chart DOM with one-click order entry and position management. Move your stops and targets in an instant. Market Depth includes a histogram, allowing you to see large-size bid or ask price levels. Over 75 properties to personalize the look and feature selection.
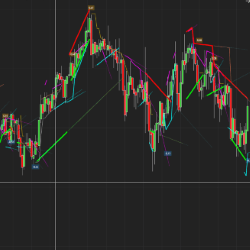
Trendlines can be drawn in so many incorrect ways. Drawing it incorrectly can make most trades losers and vice versa. Getting it right makes all the difference! QTL has a faster and far more accurate approach. Ready to automatically find the most accurate trendlines?
Whether you are an absolute beginner, or an advanced trader, this course if for you. The Professional Trading Course is a comprehensive training program or serious traders consisting of 22 video lessons, a robust trading system plus ongoing support.
This is a machine learning/price action-based automated scalping algo. It runs on a custom bar type with multiple price action algos to choose from. Custom control panel allows the trader to control and manipulate the strategy while its running and also manage multiple strategies at once.
AbleTrend offers a time-tested color-coded trading system featuring dynamic support and resistance indicators that produces buy, sell and exit trade signals. It can be used on any timeframe in the stocks, futures and forex markets. Get started with a 30-day trial for $79 today!
Simplify your trading process! The Elite Indicators predict major tops and bottoms, diagnose the direction and strength of price action, and calculate the best stop-loss and profit-target levels! Try a 30-day demo today!
The Intentional Trader’s most popular "heads-up display" indicator. Get a signal when a confluence of order flow, price action, divergence and exhaustion indicate that price could pullback from the current trend. See this indicator in action with a five-day trading room free trial.
edgeful breaks down market data into easy to read reports that instantly show you how any asset behaves, down to a specific weekday. They have all the breakdowns to tell traders when to size into a trade, when to size down, and even where to set your profit targets, based on the data, not opinions."
Looking for a great method for order entry or account/strategy management on NinjaTrader? Tyche Trading’s indicator gives you the ability to enter into trades with a click. You can use multiple instances of the indicator to trade with multiple accounts and/or strategies. Get a free trial today!
Don’t let someone else trade your idea first! We know it’s frustrating to have a great idea but not the knowledge to code it. That’s why we, a certified vendor of NinjaTrader, and our team of developers (who have 17 years of coding experience) have helped hundreds of customers. Reach out to us!
December 2, 2024
Mastering Sideways Markets With Auction Bars and Range Projections
November 19, 2024
Enhancing Your Automated Trading System: Key Insights from Best Pro Trade
November 14, 2024
NinjaTrader New Ecosystem Tools: October 2024 Edition
Enter Email for Updates