L’orderflow trading è lo studio dei volumi nel tempo e nello spazio sia nel book che nel volume profile. Individuare le zone di prezzo con maggior volume di scambio sul book e nel tempo. Studiare la dinamicità dei volumi sul book. Come usare il WVAP. Come usare il Cumulative Delta.
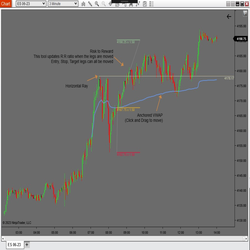
PureAlgo has developed a set of drawing tools to assist you with trading, including Anchored VWAP, Risk Reward PA and Horizontal Line. The package includes all of the tools and is priced at $10.
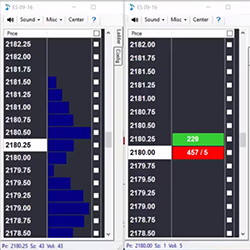
PriceSquawk empowers traders with an audible market perspective of order flow and price action across asset classes, giving traders the focus needed to respond to leading market information. Monitor markets via the customizable squawk feed, T&S trade sounds and order flow alerts.
tcVwap is an indicator for monthly, weekly and daily VWAP calculation. VWAP is an indicator representing fair price of a financial instrument. This is the Volume Weighted Average Price. The VWAP mean price is often used by institutional traders as a reference.
Hey Overachiever, I see you! Don’t worry—you’re in the right place. You’ve made a habit of outperforming, so why not arm yourself with the best team to help continue your winning streak? We code (like hackers) and launch (like marketers) your products. Click and schedule a free consultancy call.
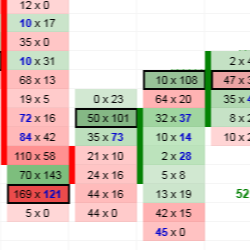
TD Order Flow features Heavy Volume Zones, multiple Volume Nodes, Imbalances, Unfinished Business, a built-in Trades Filter and a separate Cumulative Delta indicator as a bonus. It works with both futures and forex and includes 12 hours of Order Flow video training.
Use the experience of a quantitative trading system professional to help design, test, improve or optimize your trading strategy. Get a complete system analysis to have the confidence that your strategy performs exactly how it was designed to.
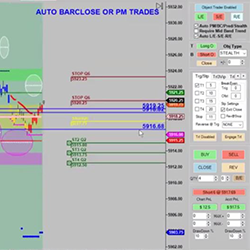
The Viper Pro Ultimate Trading Room is open for the first two hours of each trading day - Monday through Friday. Each morning, literally hundreds of traders from all over the US and throughout the world actively participate in these live market trading sessions. Live trade calls are made on as many as nine futures instruments.
Forecast oncoming trading patterns! Trade Forecaster tells you what price action to expect, allowing you to properly prepare your strategy in advance. It will alert you to oncoming scalp, swing or trend trading conditions. See a video of Trade Forecaster in action!
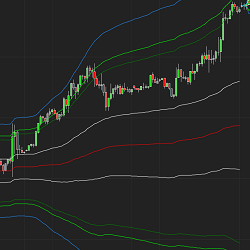
TrendFinder identifies what direction the market is moving. TrendFinder is universal and works with any market and any time interval. When an upward bias is detected, the bars are displayed in Green. When a downward bias is detected, the bars are displayed in Red.
December 2, 2024
Mastering Sideways Markets With Auction Bars and Range Projections
November 19, 2024
Enhancing Your Automated Trading System: Key Insights from Best Pro Trade
November 14, 2024
NinjaTrader New Ecosystem Tools: October 2024 Edition
Enter Email for Updates