Our Stock Trading Package includes pre-built workspaces, chart templates and Market Analyzers with scanners and alerts. Use ATS Chart Trader for trade management, ATS Inflection Point indicator for daily inflection points and use DTS Ichimoku Cloud Pattern for trade setups. Education is included!
The Three Line Strike is a trend-continuation candlestick pattern consisting of four candles. Depending on their heights and collocation, a bullish or a bearish trend continuation can be predicted. The strategy can be combined with volume and price action to identify potential trades.
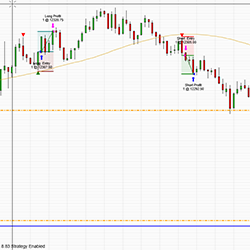
An intraday, swing or long-term trend trading indicator package that can be traded on any timeframe. Long and short arrows are generated designating entry/exit points, and trailing stops are easily identifiable based on support and resistance levels. Learn more!
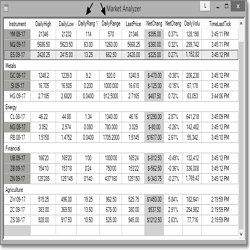
A Market Analyzer column that allows traders to view the daily range of an instrument in points or currency.
NinjaProgramminSchool has been assisting traders for over 5 years in the creation of custom indicators and automated strategies at a reasonable cost. Do you have an idea you want coded or automated? Let us walk you through the process.
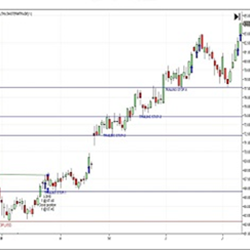
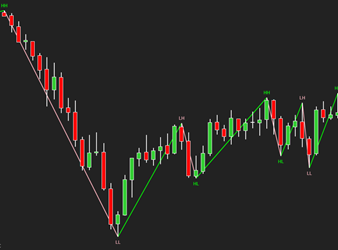
The ZigZag indicator is primarily used to identify significant highs and lows in the price chart, which helps traders filter out market noise and focus on important price movements.
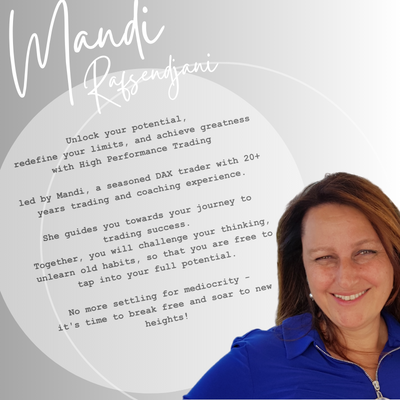
With decades experience as an active trader & accredited coach, Mandi understands what it takes to build a successful trading career. She specializes in coaching HedgeFund, Prop, Bank & Private Traders around the globe in the essential mindset aspects of trading.
Elevate your trading strategy with the Volume Levels Indicator. Detecting support and resistance from volume, it delivers precise levels respected by the price. Features include order flow cumulative delta integration, real-time order block detection, an age counter for significance tracking & more.
Use the experience of a quantitative trading system professional to help design, test, improve or optimize your trading strategy. Get a complete system analysis to have the confidence that your strategy performs exactly how it was designed to.
The Volatility Bands indicator attempts to present a way to measure and visualize volatility, using standard deviations (σ) and average true range indicator, and aims to point out areas that might indicate potential trading opportunities. Click to learn more.
December 2, 2024
Mastering Sideways Markets With Auction Bars and Range Projections
November 19, 2024
Enhancing Your Automated Trading System: Key Insights from Best Pro Trade
November 14, 2024
NinjaTrader New Ecosystem Tools: October 2024 Edition
Enter Email for Updates