The Min Pack is a starter package featuring IndicatorSmart’s most popular, important and advanced trading tools. This minimum powerhouse tool kit has the most basic, minimum components that show you the minimum of what you cannot see just by looking at an ordinary chart.
Would you like to see traders' emotions visualized right on a chart? Identify developing intraday reversals in real time, detect where retail traders place their stops and trade against them. Check historical data for solid setups. Get started with your 7-day free trial today!
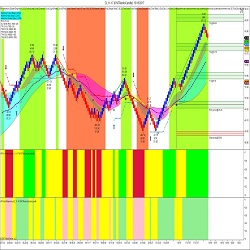
The HTS Master 2.0 is a trading solution that incorporates volatility and order flow to generate automated signals for scalping and trend following. The HTS commitment includes unlimited trading room access, private mentoring, & unlimited upgrades. Trade in Harmony now with a 2-week free trial.
Trading Mentor is an automatic system based on data science which helps traders understand the most important insights of their trading and adjust their trading strategies for consistent results.
This tool is the ultimate solution to help with your discipline and money management. This will display PNL in ticks or points on your chart, halt your ability to continue trading once you hit your risk limit and will ensure all orders are flattened before halting your trading. Free 7 day trial.
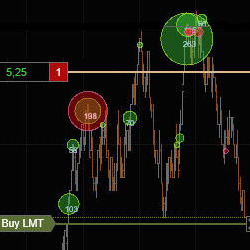
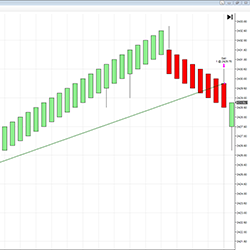
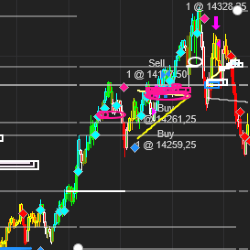
The BuySide Global Auto Trader is a state of the art automated trading system monitoring software recognition of Institutional Buy and Sell programs. The system is universal and will work in any liquid market and many timeframes. Learn more!
This algorithm calculates the support and resistance based on a look back period (number) of candles or bars and determines the support and resistance levels dynamically.
MTM can trade multiple accounts, instruments (baskets) and orders (grids) simultaneously in one trade. Submit "stealthy" orders. Flexible stop-loss and profit targets. MTM Trendicator for Forex/crypto strength. Time-based trade exits. Monitor news. Save trade profiles for re-use. And much more!
Welcome to the 7 Steps for Consistent Trading Performance. This free 7-day video course teaches about the three strategy stats based on probabilities to help you build a sustainable, scalable and reproductive (SSR) strategy for achieving consistent performance.
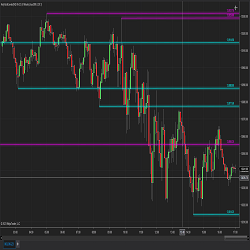
Q-Scalper indicator identifies the confluence dynamics between Support and Resistance levels with significant Trendlines, providing very significant trade levels. These levels produce very actionable and valuable trade set-ups. Click the link to explore this great indicator.
December 2, 2024
Mastering Sideways Markets With Auction Bars and Range Projections
November 19, 2024
Enhancing Your Automated Trading System: Key Insights from Best Pro Trade
November 14, 2024
NinjaTrader New Ecosystem Tools: October 2024 Edition
Enter Email for Updates