Customized private mentoring sessions with full time trader & Easy E-mini Trade owner, Trisha Ogilvie. Contact Trisha today for additional information and availability.
The market is either trending or ranging. This indicator from Tyche Trading gives you the power to know exactly when it is ranging with a high level of precision. Their Auto-Trading Range Indicator makes it easy to know what price to enter and exit your trades at. Get a seven-day free trial today!
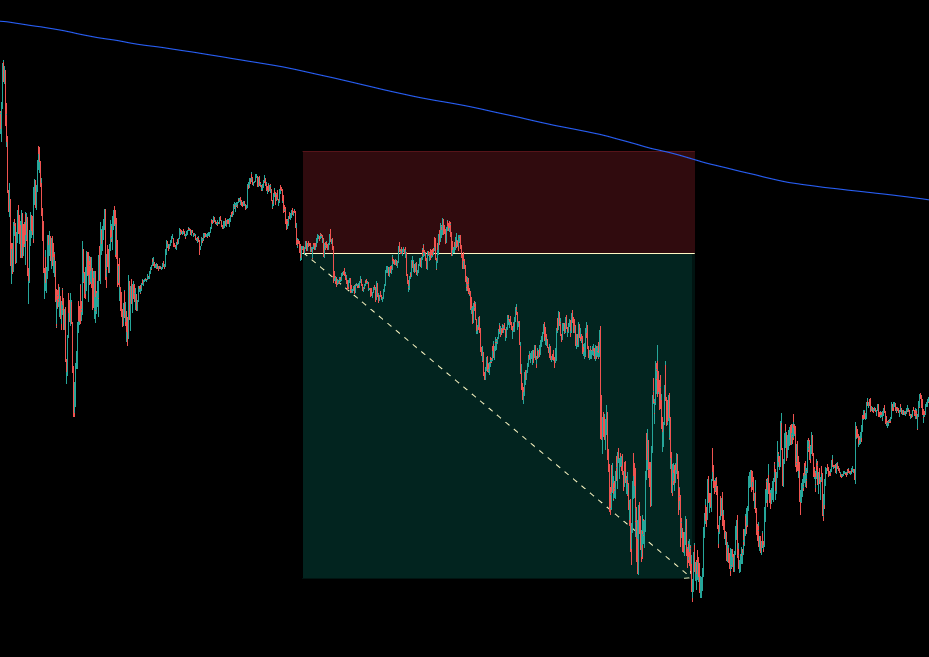
A semi-automated strategy that uses the previous days Fibonnaci range and an EMA to enter and exit trades.
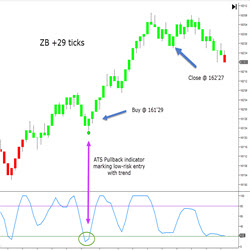
The TrendContinuation indicator identifies and alerts the trader of high probability continuation trades in the direction of the major trend. Using a time tested algorithm for determining possible low risk entries, this indicator marks the location and can notify the trader via email or text.
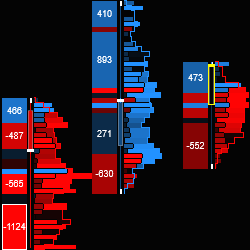
Delta Visualization System. Next-generation aggregate-able tick view of underlying order flow. Adaptive learning system highlights important price action. Bar and zone volume profile and Delta. Anchored VWAP and key Fibs. View Mini and Micro contracts on one chart. The edge you've been missing!
With this strategy you can optimize any parameter from the trend detection and strength filter to the entry and exit method, breakout or mean reversion, exiting at target or trailing the stop until the trend goes.
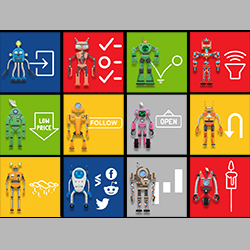
We know how it feels to have your emotions overcome your logic the moment you enter a trade. That's why we, with 15 years in software automation and day trading, created a powerful bot for ourselves... and for you! Package includes 13 custom indicators and strategies. Download your free trial today!
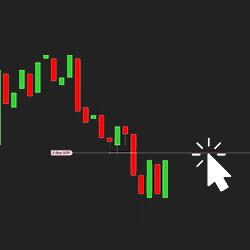
Looking for a great method for order entry or account/strategy management on NinjaTrader? Tyche Trading’s indicator gives you the ability to enter into trades with a click. You can use multiple instances of the indicator to trade with multiple accounts and/or strategies. Get a free trial today!
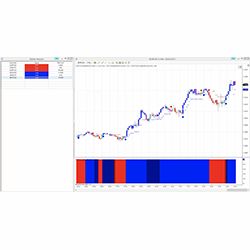
Our Day Trading software is based on price, support & resistance. It has undergone over 1000 hours of machine learning to build its algorithm. We send out algorithm updates regularly to keep the system performing. Built and tuned for day trading, it comes with a market analyzer radar screen.
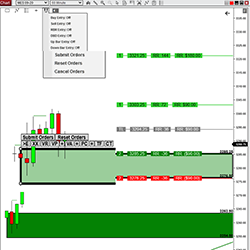
PFAHedger is an innovative addon to the PFAZoneSuite supply & demand indicator, providing the ability to submit hedging positions on any market. Simultaneously submit trades on any market while submitting hedge orders on another market, directly from the same chart.
December 2, 2024
Mastering Sideways Markets With Auction Bars and Range Projections
November 19, 2024
Enhancing Your Automated Trading System: Key Insights from Best Pro Trade
November 14, 2024
NinjaTrader New Ecosystem Tools: October 2024 Edition
Enter Email for Updates