Volatility Quality Indicator (VQI) is a technical indicator that was developed to identify quality stocks with low volatility. The indicator is based on the assumption that assets with low volatility are less risky & more stable. The original concept by Thomas Stridsman was first published in 2002.
PriceIsKing.com's Stocks RAM Indicator is a powerful tool based on years of research and testing that shows equities traders entry points with arrows when the right condition is met. Get started with a free 2-week trial today!
Manage your risk by setting drawdown limits and goals! If your drawdown limits are hit, the system prevents you from trading further. If your goal is hit, you can trade but never giving back more than your set amount. If hit, you're done for the day/week. This is your preset Dynamic Drawdown Limit.
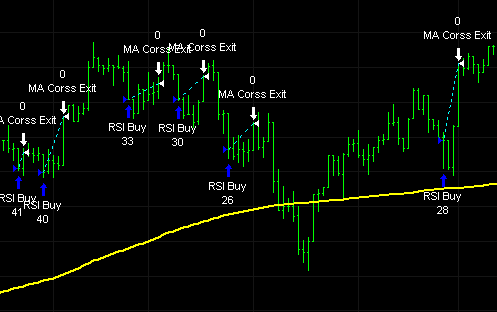
The Connors RSI2 strategy is a popular and well-known trading strategy developed by Larry Connors. It is designed to identify short-term overbought or oversold conditions in a market and exploit potential mean-reversion opportunities.
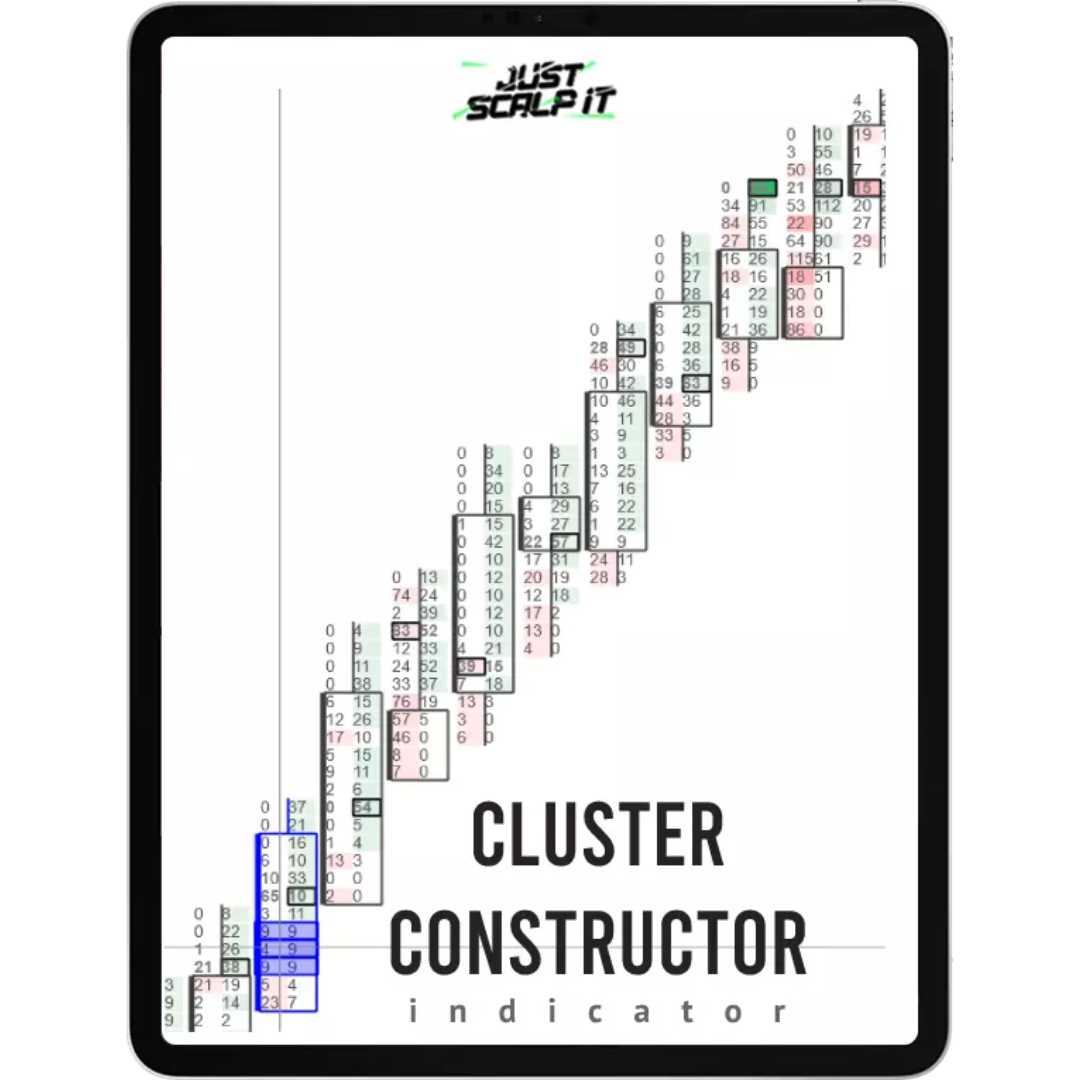
Explore the advanced order flow indicator, Cluster Constructor, featuring 16+ filters for deep market analysis (footprint charts). Ideal for unveiling smart money and institutional trends, enhancing order flow trading strategies. Delve into sophisticated insights – start now!
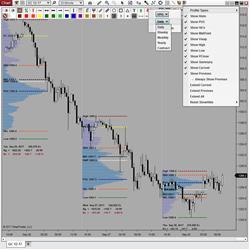
Volume Profile Sessions features 5 Profile Durations (Daily, Weekly, Monthly, Yearly, Contract) and 3 Modes of Calculation (bar/min/tick). It displays 8 Levels of Significance (VPOC, VA's, VWAP, High/Low/Mid, PClose) & session summaries, and provides simple configuration thru a toolbar icon!
The MCumulativeDelta Indicator shows the bid / ask volume displayed in a histogram over a period. It serves to determine whether supply or demand is dominating and in control and the buying / selling pressure.
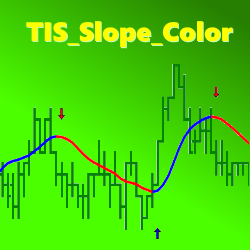
The TIS_Slope_Color indicator allows traders to detect the slope change of any line from any indicator. It can then paint the line, the background, or paint entry signals on a chart.
A category of automated tools designed for consistent rule-based trading management. Experience a structured approach to digital trading.
PFAHedger is an innovative addon to the PFAZoneSuite supply & demand indicator, providing the ability to submit hedging positions on any market. Simultaneously submit trades on any market while submitting hedge orders on another market, directly from the same chart.
December 2, 2024
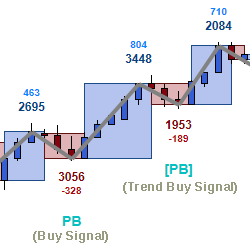
Mastering Sideways Markets With Auction Bars and Range Projections
November 19, 2024
Enhancing Your Automated Trading System: Key Insights from Best Pro Trade
November 14, 2024
NinjaTrader New Ecosystem Tools: October 2024 Edition
Enter Email for Updates