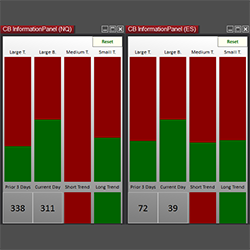
CB Information Panel gives you a snapshot of the buyers and sellers. Keep track of the prior day’s ranges and trend movement.
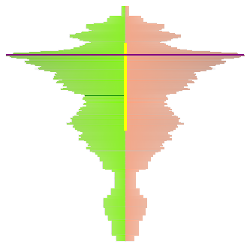
Volume has gravity, and the market has a memory. See each bar's volume profile simply and clearly with the TC_BarProfiler. Look inside the bar to see where the action happened, and detect the important price levels. Free to download for NinjaTrader 7 & NinjaTrader 8!
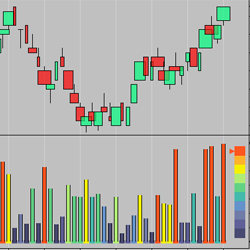
The IT_VolZoom, shown with IT_FatBars (uses same engine), shows volume level relative to the surrounding volume. The histogram is colored according to a 10 step heat meter which is shown on the right (bar colors optional). It accurately shows high volume even in low volume conditions.
Live trading room for ES S&P 500 day traders. Based on Rose’s Fibonacci trading system, charts are posted and price action shared. Previous trades are reviewed so that students can improve. Discord chat room goals: help students become independent traders & provide a supportive community.
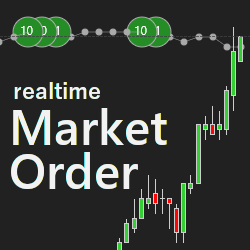
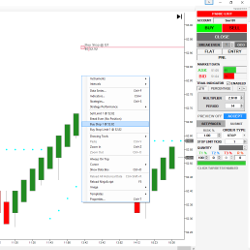
Dynamically see real-time market orders of buyers and sellers in the normal candlestick chart. Get a better feel for the market and its dynamics at the important price zones. Get started today with a two-week free trial!
Flagship Program teaching the convergence of Elliott Waves, Fibonacci and Harmonics with a simple strategy which offers trade setups for each part of the market cycle. Learn six trade setups with trade plans. Good for day, swing and position traders.
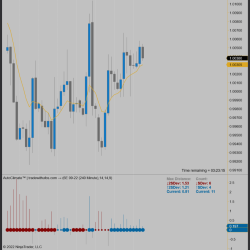
Intelligent technology assesses the market environment from a statistical point of view in order to answer the key questions before a trade: “Which side of the market should I be in?”, “Should I be a buyer or a seller?”, or “Should I simply avoid trading and not trade at all?”
Trading requires edge, but in the new world of machine and algorithmic trading disrupting information processing and decision making, it’s incredibly elusive. Boss Trading addresses this problem by introducing professional experience and trader role modelling via live trading masterclasses.
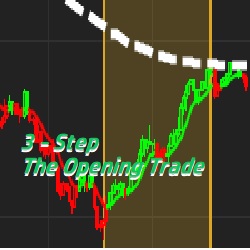
The 3 Step Indicator and Workspace package from The Opening Trade combines three basic elements into a simple Red vs Green color coded, Mean Reversion Discretionary System. Price Action, Trend Strength and Supply and Demand are what drive this 3 Step System.
PureLogikTrading, LLC has over 10 years of experience in programming add-ons for the NinjaTrader platform. Trading strategies are built upon the LogikStrategyCore framework, which provides traders with a number of enhancements for their custom trading solutions. Get a free quote today!
December 2, 2024
Mastering Sideways Markets With Auction Bars and Range Projections
November 19, 2024
Enhancing Your Automated Trading System: Key Insights from Best Pro Trade
November 14, 2024
NinjaTrader New Ecosystem Tools: October 2024 Edition
Enter Email for Updates