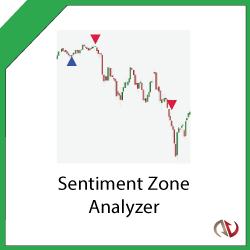
Use the Sentiment Zone Analyzer to measure overall market sentiment to spot trend reversals early! Based on the premise that extremely bullish or bearish tendencies will eventually lead to trend reversals. Dynamically calculates overbought and oversold levels based on previous price action.
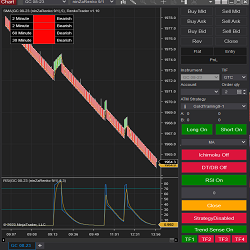
Renko Trader is an Indicator Tool that allows you to create algorithm strategies using multiple time frames, moving averages, rsi, renko charts and ichimoku cloud. You will be able to customize your strategies using various parameters. Includes dynamic interface to turn strategy on and off.
Scalping: Takes fast and precise trades. Dual-Exit Strategy: Take Profit and Stop Loss. Finds patterns in the data and defines probabilities. Choose the number of contracts. Optimize parameters and adjust your trading style. Works in the NQ and GC futures contracts.
BuySide Global’s proprietary software algorithms track Institutional Traders as they change their bids and offers, identify when Institutions are selling into the highs or buying into the lows and deliver real-time buy and sell signals on time-tested strategies. Learn more!
This incredibly innovative suite of Bollinger Bands and divergence indicators shows selected, plotted ‘dots’ with a broad selection of Bollinger Band combinations. You can choose from seven indicator combinations!
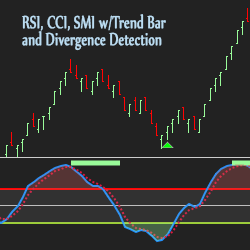
Use UppDnn.com’s Momentum Indicators to identify divergence and momentum changes as signals emerge at reversal areas. These upgraded indicators include Relative Strength Index (RSI) with Divergence Detection, Commodity Channel Index (CCI) and Stochastic Momentum Index (SMI) with a Trend Bar.
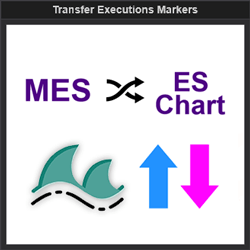
This indicator allows the user to obtain execution data from one instrument and overlay it on another. This increases application functionality and charting efficiency.
Douro Day Trading indicators are specifically designed for five minute chart trading targeting the European open, US premarket, US open and US. They are also designed for 5 minute, 15 minute and 60 minute combination trading, and produce up to 60 valid trades in a 24 hour period.
These consulting services are tailored to meet the unique needs of trading companies, offering expert advice and innovative strategies to enhance performance and profitability. They provide in-depth market analysis, risk management solutions, and trading strategies designed to maximize your success.
tcVwap is an indicator for monthly, weekly and daily VWAP calculation. VWAP is an indicator representing fair price of a financial instrument. This is the Volume Weighted Average Price. The VWAP mean price is often used by institutional traders as a reference.
December 2, 2024
Mastering Sideways Markets With Auction Bars and Range Projections
November 19, 2024
Enhancing Your Automated Trading System: Key Insights from Best Pro Trade
November 14, 2024
NinjaTrader New Ecosystem Tools: October 2024 Edition
Enter Email for Updates