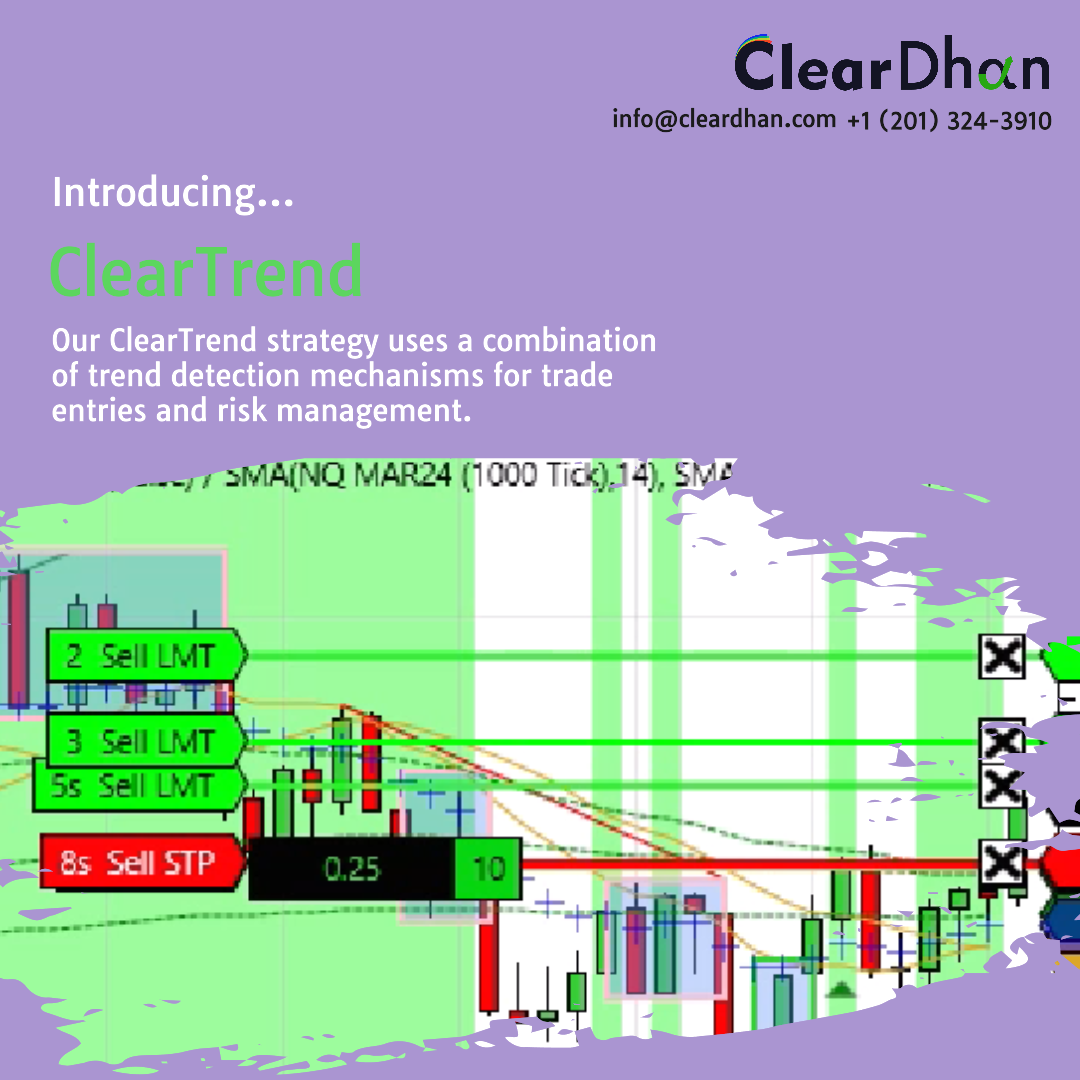
ClearTrend uses a combination of trend detection mechanisms for trade entries and risk management. Works to identify optimal trades using real-time time responsiveness to opportunities using trend strength. Available as a fully automated strategy or as an indicator form. Five-day free trial.
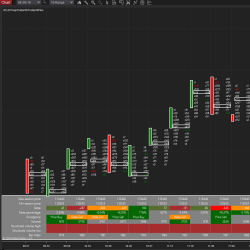
itcFootprint is an indicator for Order Flow and footprint. It displays data from the tape as footprint bars and also provides a statistic panel with powerful tools like delta analysis, divergence, volume structure, and unfinished business (bar by bar).
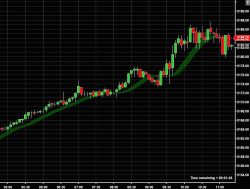
Is it a trend or a movement? Trend Ribbon uses one color to indicate an uptrend and another to indicate a downtrend. The ribbon shows trend strength and the transition of direction when the ribbon narrows and “flips.” Fully adjustable to your style and timeframe: day, swing or longer trading.
Our Partner Programmer service is ideal for traders with great ideas and a limited budget. We help code your ideas and instead of paying for the programming service, we enter a joint investment agreement.
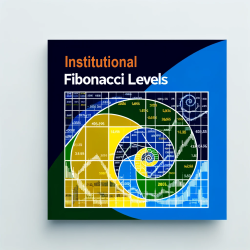
Fibonacci LevelsL Institutional Support and Resistance Levels by DTB Traders offer unparalleled accuracy for futures market trading. With automatic adjustments for new highs and lows, save hours on analysis across multiple instruments and time frames.
The Trading Room Package is what IndicatorSmart uses in their trading rooms to get the most out of the market (highly recommended). Leases are also available for trading room members.
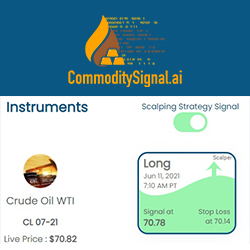
CommoditySignal.ai is an AI-powered Robo Advisor! Trade energy, metals, and agro commodities futures like crude, gold, and silver with an AI algorithm's expertise. Additional features like newsroom and chatroom keep you updated on the latest trends. Free forever - no need for a credit card!
The market efficiency is an oscillator-based gauge which monitors bid and offer information in an adaptive sequence. By monitoring such action, the user will be able to determine efficient (directional) or inefficient (turning) price action.
In this course you will learn how to code add-ons for NinjaTrader 8. It consists of over 10 lectures on how to create custom windows, pass data from strategies into add-ons, create beautiful charts using 3rd party libraries and use statistics to find new ideas for building systems.
You can download and try our best free indicators for NinjaTrader 8 now! These indicators are free for life. 24-hour technical support. Watch video tutorials on indicator details and how to use them. Hurry! Click here to download and use now!
December 2, 2024
Mastering Sideways Markets With Auction Bars and Range Projections
November 19, 2024
Enhancing Your Automated Trading System: Key Insights from Best Pro Trade
November 14, 2024
NinjaTrader New Ecosystem Tools: October 2024 Edition
Enter Email for Updates