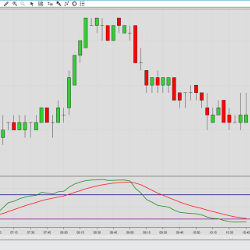
The Slow Relative Strength Index is an adaptation of the classic RSI calculation, customized for use in higher timeframes. The slow RSI calculation compares the close price with an exponential moving average instead of the previous value.
Backtest any trading system ever invented ranging from a mechanical system (MA Cross) to a discretionary system (Elliot Wave). The backtesting tool has built in statistics calculations, as well as an easy-to-learn logging system. It works on Futures, Forex or Stocks. Grab a 7-day free trial now!
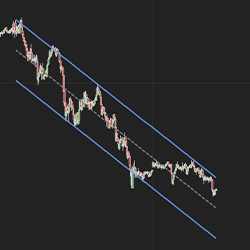
Trend channels are one of the most respected trading strategies used in the markets. However, they can sometimes be tricky to draw, and it's difficult to know if your lines are accurate. Tyche Trading’s unique Price Action Trend Channel Indicator makes it easy! Get a seven-day free trial today!
XABCD News puts news events on your chart so you're not surprised when news comes out. It works in any market and provides a visual marker for scheduled economic news for the current seven-day week, from Sunday to Sunday. Get your free copy today.
If you've never considered support and resistance from the perspective of volume – think again. Light volume regions indicate price action passing through and a great signal for continuation of trend. High volume suggests a pause point. Just what you need to know in advance. So, grab yours now!
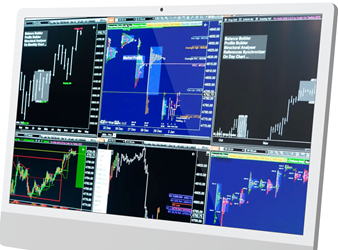
Elevate your trading with the ultimate toolset. The gold plan includes 9 NinjaTrader indicator modules and 13 NinjaTrader drawing tool modules. Seamlessly communicate between market profile and other charts. Utilize the top down approach analysis for daily, weekly, monthly and short-term charts.
Track NYSE and NASDAQ market breadth divergence directly from your price chart - even on Renko bars! Optimal Breadth seamlessly integrates advance-decline internals with your price chart and plots three intraday divergence types: classic, hidden and micro. Never miss a signal again!
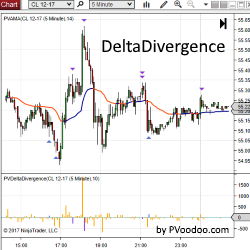
PVDeltaDivergence Indicator is a powerful tool designed to help traders identify possible turning points in their favorite markets with order flow analysis. Get a free trial of PVDeltaDivergence for NinjaTrader today!
With decades of experience, EMS specializes in the creation of custom software for clients worldwide. For over twenty-five years, EMS has been helping our clients reach their goals with honesty, integrity and fairness. Contact us for a complementary consultation.
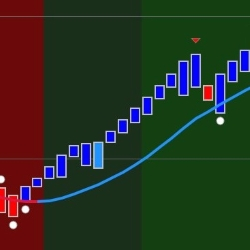
Scalper Pivot Point allows traders to identify turning points, and aids in spotting trends and reversals. It can be loaded on any data-compression type of chart. When several conditions met, a signal is plotted on the user’s chart. See samples of the Scalper Pivot Point in action on NinjaTrader!
December 2, 2024
Mastering Sideways Markets With Auction Bars and Range Projections
November 19, 2024
Enhancing Your Automated Trading System: Key Insights from Best Pro Trade
November 14, 2024
NinjaTrader New Ecosystem Tools: October 2024 Edition
Enter Email for Updates