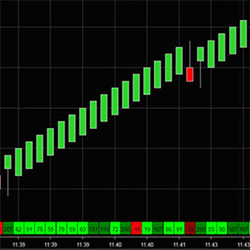
Market Delta Volume Profile is designed to distinguish if buyers or sellers are in control & to see breakdown of volume in each bar. It’s used to identify price reversal areas and look into the price action of each Renko bar to view volume profile, price & monitor order flow.
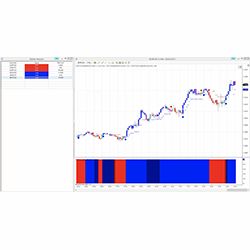
Our Day Trading software is based on price, support & resistance. It has undergone over 1000 hours of machine learning to build its algorithm. We send out algorithm updates regularly to keep the system performing. Built and tuned for day trading, it comes with a market analyzer radar screen.
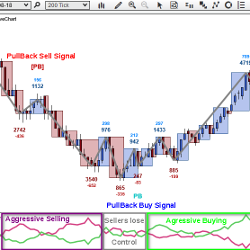
The MBidAskOscillator separates volume into trades executed at the best bid price, and trades executed at the best ask price. This indicator gives traders insight into market action, because evidence of aggressive selling or buying is clearly represented.
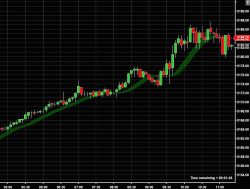
Is it a trend or a movement? Trend Ribbon uses one color to indicate an uptrend and another to indicate a downtrend. The ribbon shows trend strength and the transition of direction when the ribbon narrows and “flips.” Fully adjustable to your style and timeframe: day, swing or longer trading.
Experience first-hand how Touch Zone Trading identifies opportunities & manages trades. Whether you’re trading part-time or full, you’ve got to be ‘in the zone’ to perform. Are you a good fit for the Touch Zone Trade Room? Take the trader survey!
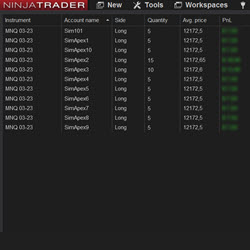
With this tool you can copy your own trades to multiple accounts from the same broker. If you use Propfirms with multiple accounts this is a must have for you. You can trade up to 20 accounts, open orders between different instruments, and have the possibility for an order multiplier.
The Lighthouse Trading strategy works fully automatically in the futures market. The algorithm analyses time and sales, volume, rhythm and acceleration in real time. Its objective is to search for patterns to help determine who controls the market.
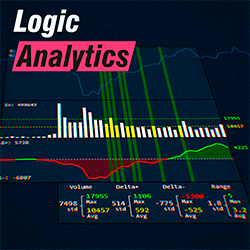
Visualize the relationship between delta and volume with accurate statistical calculations on delta, ask, bid, and volume. This tool combines the power of data analysis with advanced charting, allowing you to see the most relevant market movements.
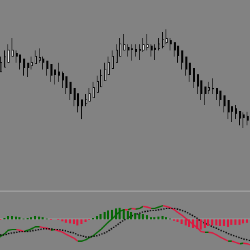
The EPyFMACD indicator has additional functionality such as Cross Color and UpDown, increasing the amount of visual information conveyed. The color and thickness of the EPyFMACD can also be customized.
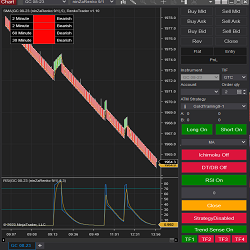
Renko Trader is an Indicator Tool that allows you to create algorithm strategies using multiple time frames, moving averages, rsi, renko charts and ichimoku cloud. You will be able to customize your strategies using various parameters. Includes dynamic interface to turn strategy on and off.
December 2, 2024
Mastering Sideways Markets With Auction Bars and Range Projections
November 19, 2024
Enhancing Your Automated Trading System: Key Insights from Best Pro Trade
November 14, 2024
NinjaTrader New Ecosystem Tools: October 2024 Edition
Enter Email for Updates