See trade setups develop in real time in the Easy E-mini Trade Chat Room! Open Monday – Thursday 9:15 – 12:00 ET, sign up for your 3-day trial today!
Epic Social will trigger trades based on social activity from Twitter, Reddit, and StockTwits. The package includes both an indicator and a strategy with multiple trade setups that are based on volume and social activity. Download a 30-day trial!
KaseX is a symbol based technical analysis trading study with a simple, uncluttered display. KaseX captures dozens of complex technical signals in multiple time-frames. Variable optimization is unnecessary as pre-configured sensitivity settings are built in. Take a free 30-day trial today!
MTM can trade multiple accounts, instruments (baskets) and orders (grids) simultaneously in one trade. Submit "stealthy" orders. Flexible stop-loss and profit targets. MTM Trendicator for Forex/crypto strength. Time-based trade exits. Monitor news. Save trade profiles for re-use. And much more!
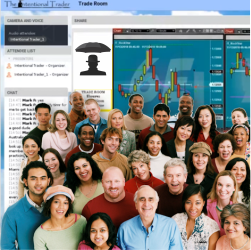
Day trading six futures instruments every day from 9am until 12pm Eastern time. Watch the Intentional Trader system in action in real time. Listen to a trade room moderator call out trades before entering them. They have been trading the same system and indicators since 2009!
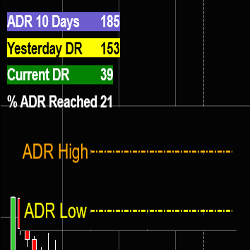
This highly customizable NinjaTrader 8 indicator displays the average daily range allowing users to spot related trading opportunities. T2SSmartADR also provides notifications when the average daily range is reached and when there is a high probability of reversal trades.
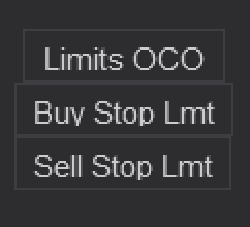
Bars Edge Trader Button and OCO Timer pack for NinjaTrader 8. An easy fast solution to apply Limit Orders to your Chart Trader. Included are three timers for adding OCO Limits entries throughout the day to catch a news cycles semi-automatically.
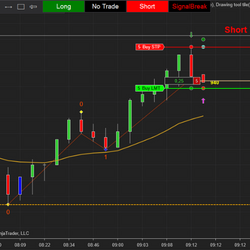
Trade two-legged pullback with this Second Entry Indicator! This is a semi-automated, two-legged pullback strategy using the built-in trading-buttons. Get alerts and your orders are placed automatically at the correct spot (no more dragging orders).
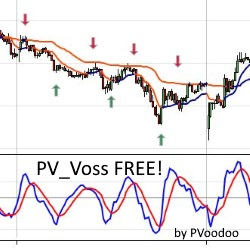
Try this FREE Voss Predictive Filter by John Ehlers & Henning U. Voss, with source code included by PVoodoo.com. Test it today for free!
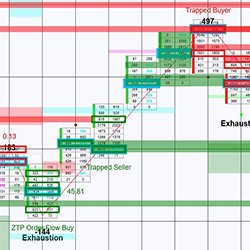
The ZoneTraderPro Order Flow Pattern Indicator identifies 7 different patterns, including tops and bottoms in a market using the Point of Control, trapped traders, ratios, historical support and resistance, and the exclusive ZTP Order Flow. Learn when to buy and sell based on order flow!
December 2, 2024
Mastering Sideways Markets With Auction Bars and Range Projections
November 19, 2024
Enhancing Your Automated Trading System: Key Insights from Best Pro Trade
November 14, 2024
NinjaTrader New Ecosystem Tools: October 2024 Edition
Enter Email for Updates