The Jurik Volatility Bands can be used for entries for trends by using the zero line crosses whilst counter-trend trades can be made once the oscillator line is close to the outer bands. It works in range-bound and trending markets.
This system will take you through the process of how to "risk 1 to make 2" that professional traders utilize to increase their profitability and have consistent months, quarters and years. The system incorporates philosophies found in "Trading in the Zone" by Mark Douglas.
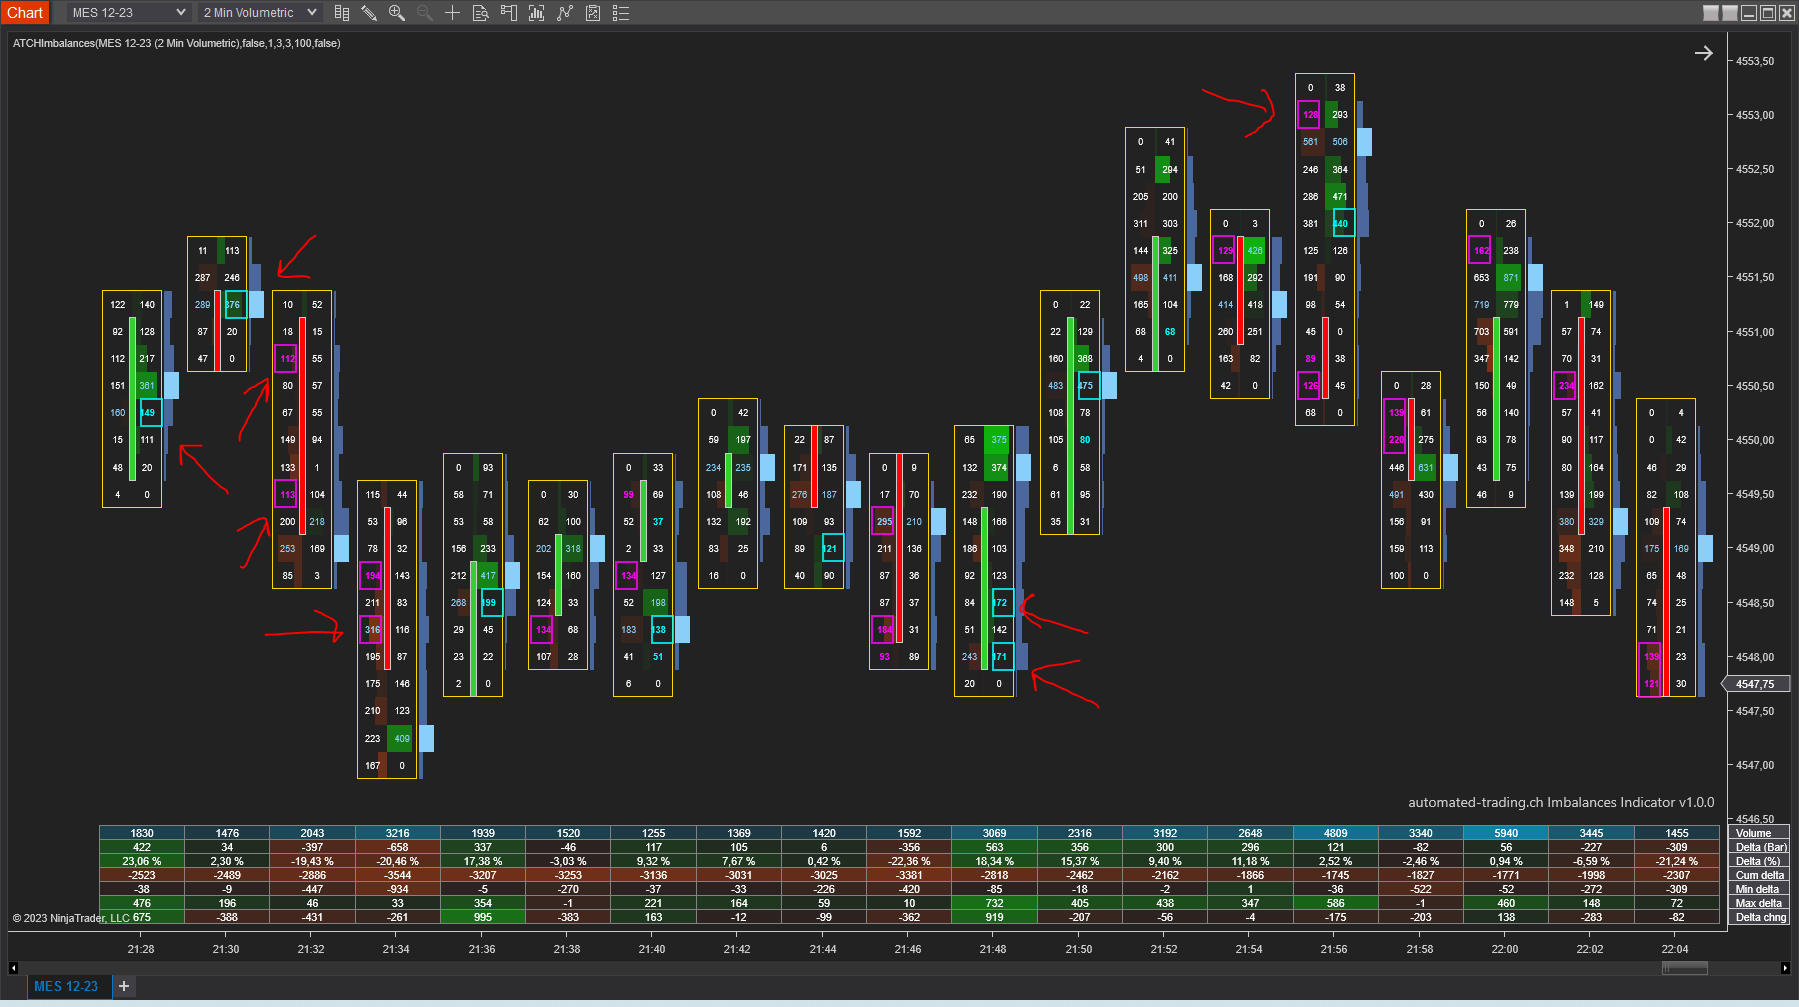
Volume imbalances is a free NinjaTrader 8 indicator that highlights diagonal volume imbalances on both footprint charts and regular candlestick charts. Imbalances occurs on price levels where trade volume on one side (bid/ask) is excess over the trade volume on the opposite side.
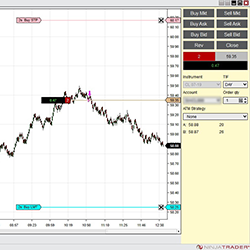
Download this free indicator that allows you to trade directly on your chart. You no longer need to use buttons to enter the market. With this indicator, you can select your entry point directly on the chart. Quickly place limit orders with a single click of the mouse (no need to right-click).
A powerful self-study program that will help you learn the core principles and implementation of the Hunt Volatility Funnel Method with a total of 18 hours of material, topic by topic, alongside case studies and live trading webinars.
Master quantitative trading with our courses. From back-testing basics to advanced strategy development, learn to build systematic trading systems. Explore futures, pairs trading, & essential Python programming tailored for financial markets. Gain a trading edge with real-world examples. Enroll now!
This robust pattern recognition strategy for day trading futures, stocks and FX has been used for Crude Oil futures trading since November 2017. It includes fully customizable parameters based on your individual risk tolerance level. Contact us to lease/purchase or explore synergistic opportunities.
Traderistic helps to get rid of fear in trading by looking for signs of fear that can impact a trader’s performance. This tool live-monitors the biggest muscle in the body, the heart. Traders can develop a new level of awareness to increase control and serenity, making trading an enjoyable exercise.
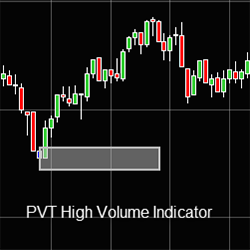
Precision Volume Trading High Volume Indicator lets you know where the volume is being traded to trade with high liquidity.
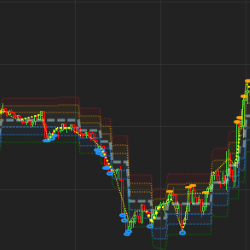
This indicator tracks the Smart Money flow in the market. Following the Smart Money provides a better understanding of the volatility size and trend direction. Ready to see what the Smart Money is doing?
December 2, 2024
Mastering Sideways Markets With Auction Bars and Range Projections
November 19, 2024
Enhancing Your Automated Trading System: Key Insights from Best Pro Trade
November 14, 2024
NinjaTrader New Ecosystem Tools: October 2024 Edition
Enter Email for Updates