Nova Wynd RK is a renko-optimized version of the Nova Wynd indicator. We eliminate the High & Low prices and only focus on the Close price in the calculation of the reference price. ninZaATR is also replaced by Tick as the unit of offset.
The BG Levels indicator displays institutional buy and sell levels - where the “smart money” is buying and selling - and where they are exiting. The premise is to buy at a cross of the Level Up line (to the upside) and exit your long position at the Target line (to the downside).
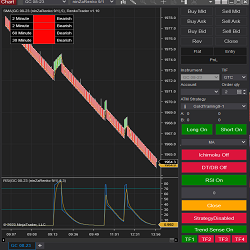
Renko Trader is an Indicator Tool that allows you to create algorithm strategies using multiple time frames, moving averages, rsi, renko charts and ichimoku cloud. You will be able to customize your strategies using various parameters. Includes dynamic interface to turn strategy on and off.
Turn your ideas into code! We work 1-on-1 with you to understand your needs and engineer a quality software solution that meets them. Automated strategies, indicators, data analytics, portfolio supervision – let us know your needs, we’re here to make it happen. Get in touch with us today!
The Helix strategy is the combination of our Entry Zone indicator and the Trade Management strategy, hence the name Helix (or double Helix). Helix allows you to create your Entry Zones based on your setup rules. Then, after trade execution, Helix will manage the trade based on your rules.
Our custom indicators include automated plotting of trend wave counts, cycles (timing for entries and exits), momentum strength, support & resistance, divergence patterns and some Japanese candlestick patterns.
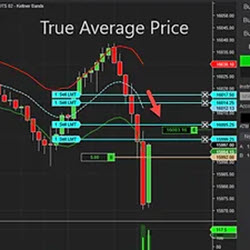
Discover accuracy with the True Average Price Indicator. Move beyond FIFO methods and accurately track your average price on NinjaTrader. This tool provides real-time insights into your position's average cost, enabling smarter trading decisions. Elevate your strategy with informed precision.
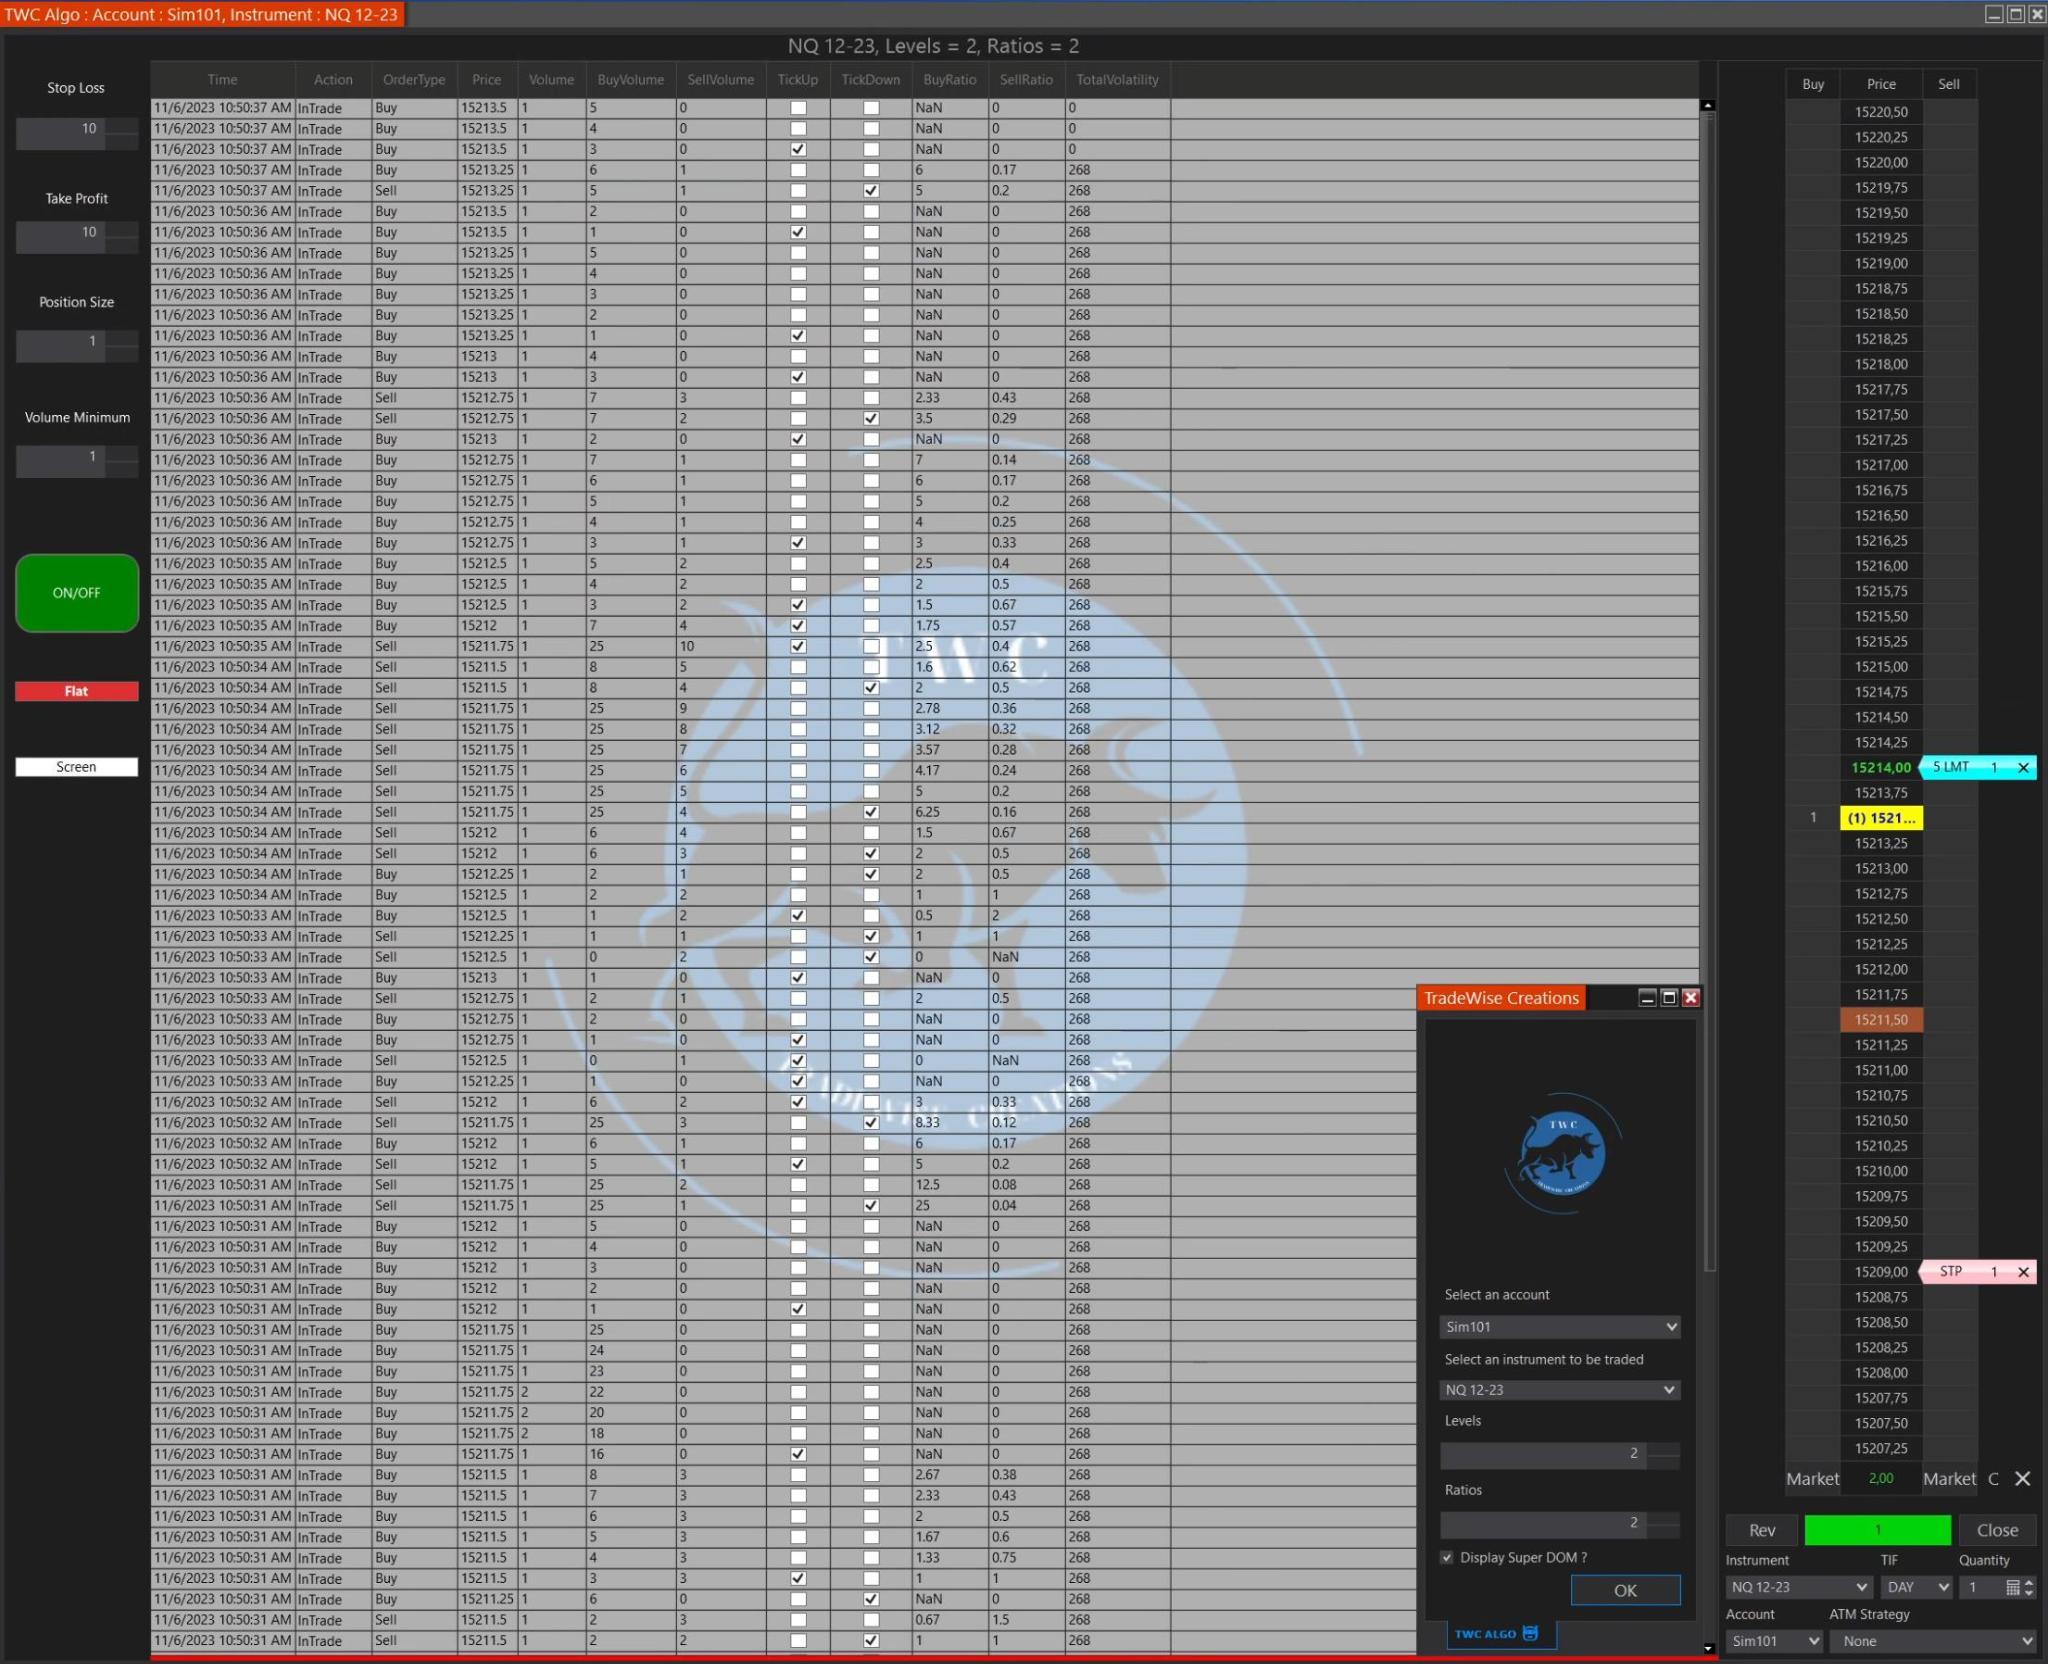
The TWC Semi-Auto Algo is a trading algorithm designed to calculate a ratio between buyers and sellers in the stock market. This type of algorithm is often used by traders to make informed decisions on when to enter the market.
Do you want to overcome the challenges that leave traders feeling overwhelmed and uncertain? Have you tried to solve that losing pattern in your trading behavior but failed? This e-course, based on the latest neuroscience, will solve the mystery of your trading mind versus the collective market.
Predict the ultimate stop level using the sophisticated NSR Triple STX, which performs over a million calculations per bar. Measure the trend strength using the non-arbitrary Ocean math with the BTX indicators. Includes Ocean Classic. Sign up for a 30 day free trial!
December 2, 2024
Mastering Sideways Markets With Auction Bars and Range Projections
November 19, 2024
Enhancing Your Automated Trading System: Key Insights from Best Pro Trade
November 14, 2024
NinjaTrader New Ecosystem Tools: October 2024 Edition
Enter Email for Updates