Learn from a certified Mental Performance Coach and Veteran Trader! Discover how to control that voice inside of you that causes you to chase trades, enter too early, revenge trade, fear of missing out (FOMO), over trade, under trade, and blow accounts. And the list goes on...
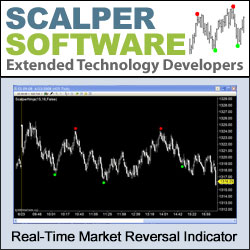
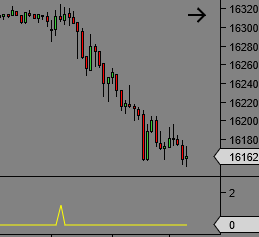
Scalper Pivot Point allows traders to identify turning points, and aids in spotting trends and reversals. It can be loaded on any data-compression type of chart. When several conditions met, a signal is plotted on the user’s chart. See samples of the Scalper Pivot Point in action on NinjaTrader!
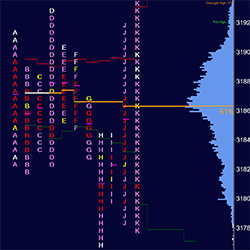
This is more than the classic Market Profile indicator available on the market today. All meaningful reference levels are automatically drawn for you. All Dalton market generated data have been programmed. Weak buy and sell levels, tails, poor extremes and much more!
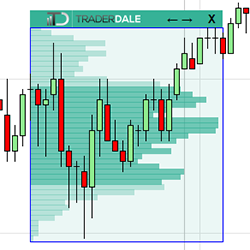
TD’s Flexible Volume Profile helps to reveal institutional trading activity and identifies the strongest support and resistance zones. The use of tick volume data makes it extremely precise leading to potential entries. It is easy to learn, simple to use, and extremely intuitive.
You can now calculate your recommended trade position size for stocks based on the current market volatility and your risk appetite, in real time. Once you input the “RiskPerTrade” amount, It displays the number of shares in your market analyzer column. Get this powerful risk management tool!
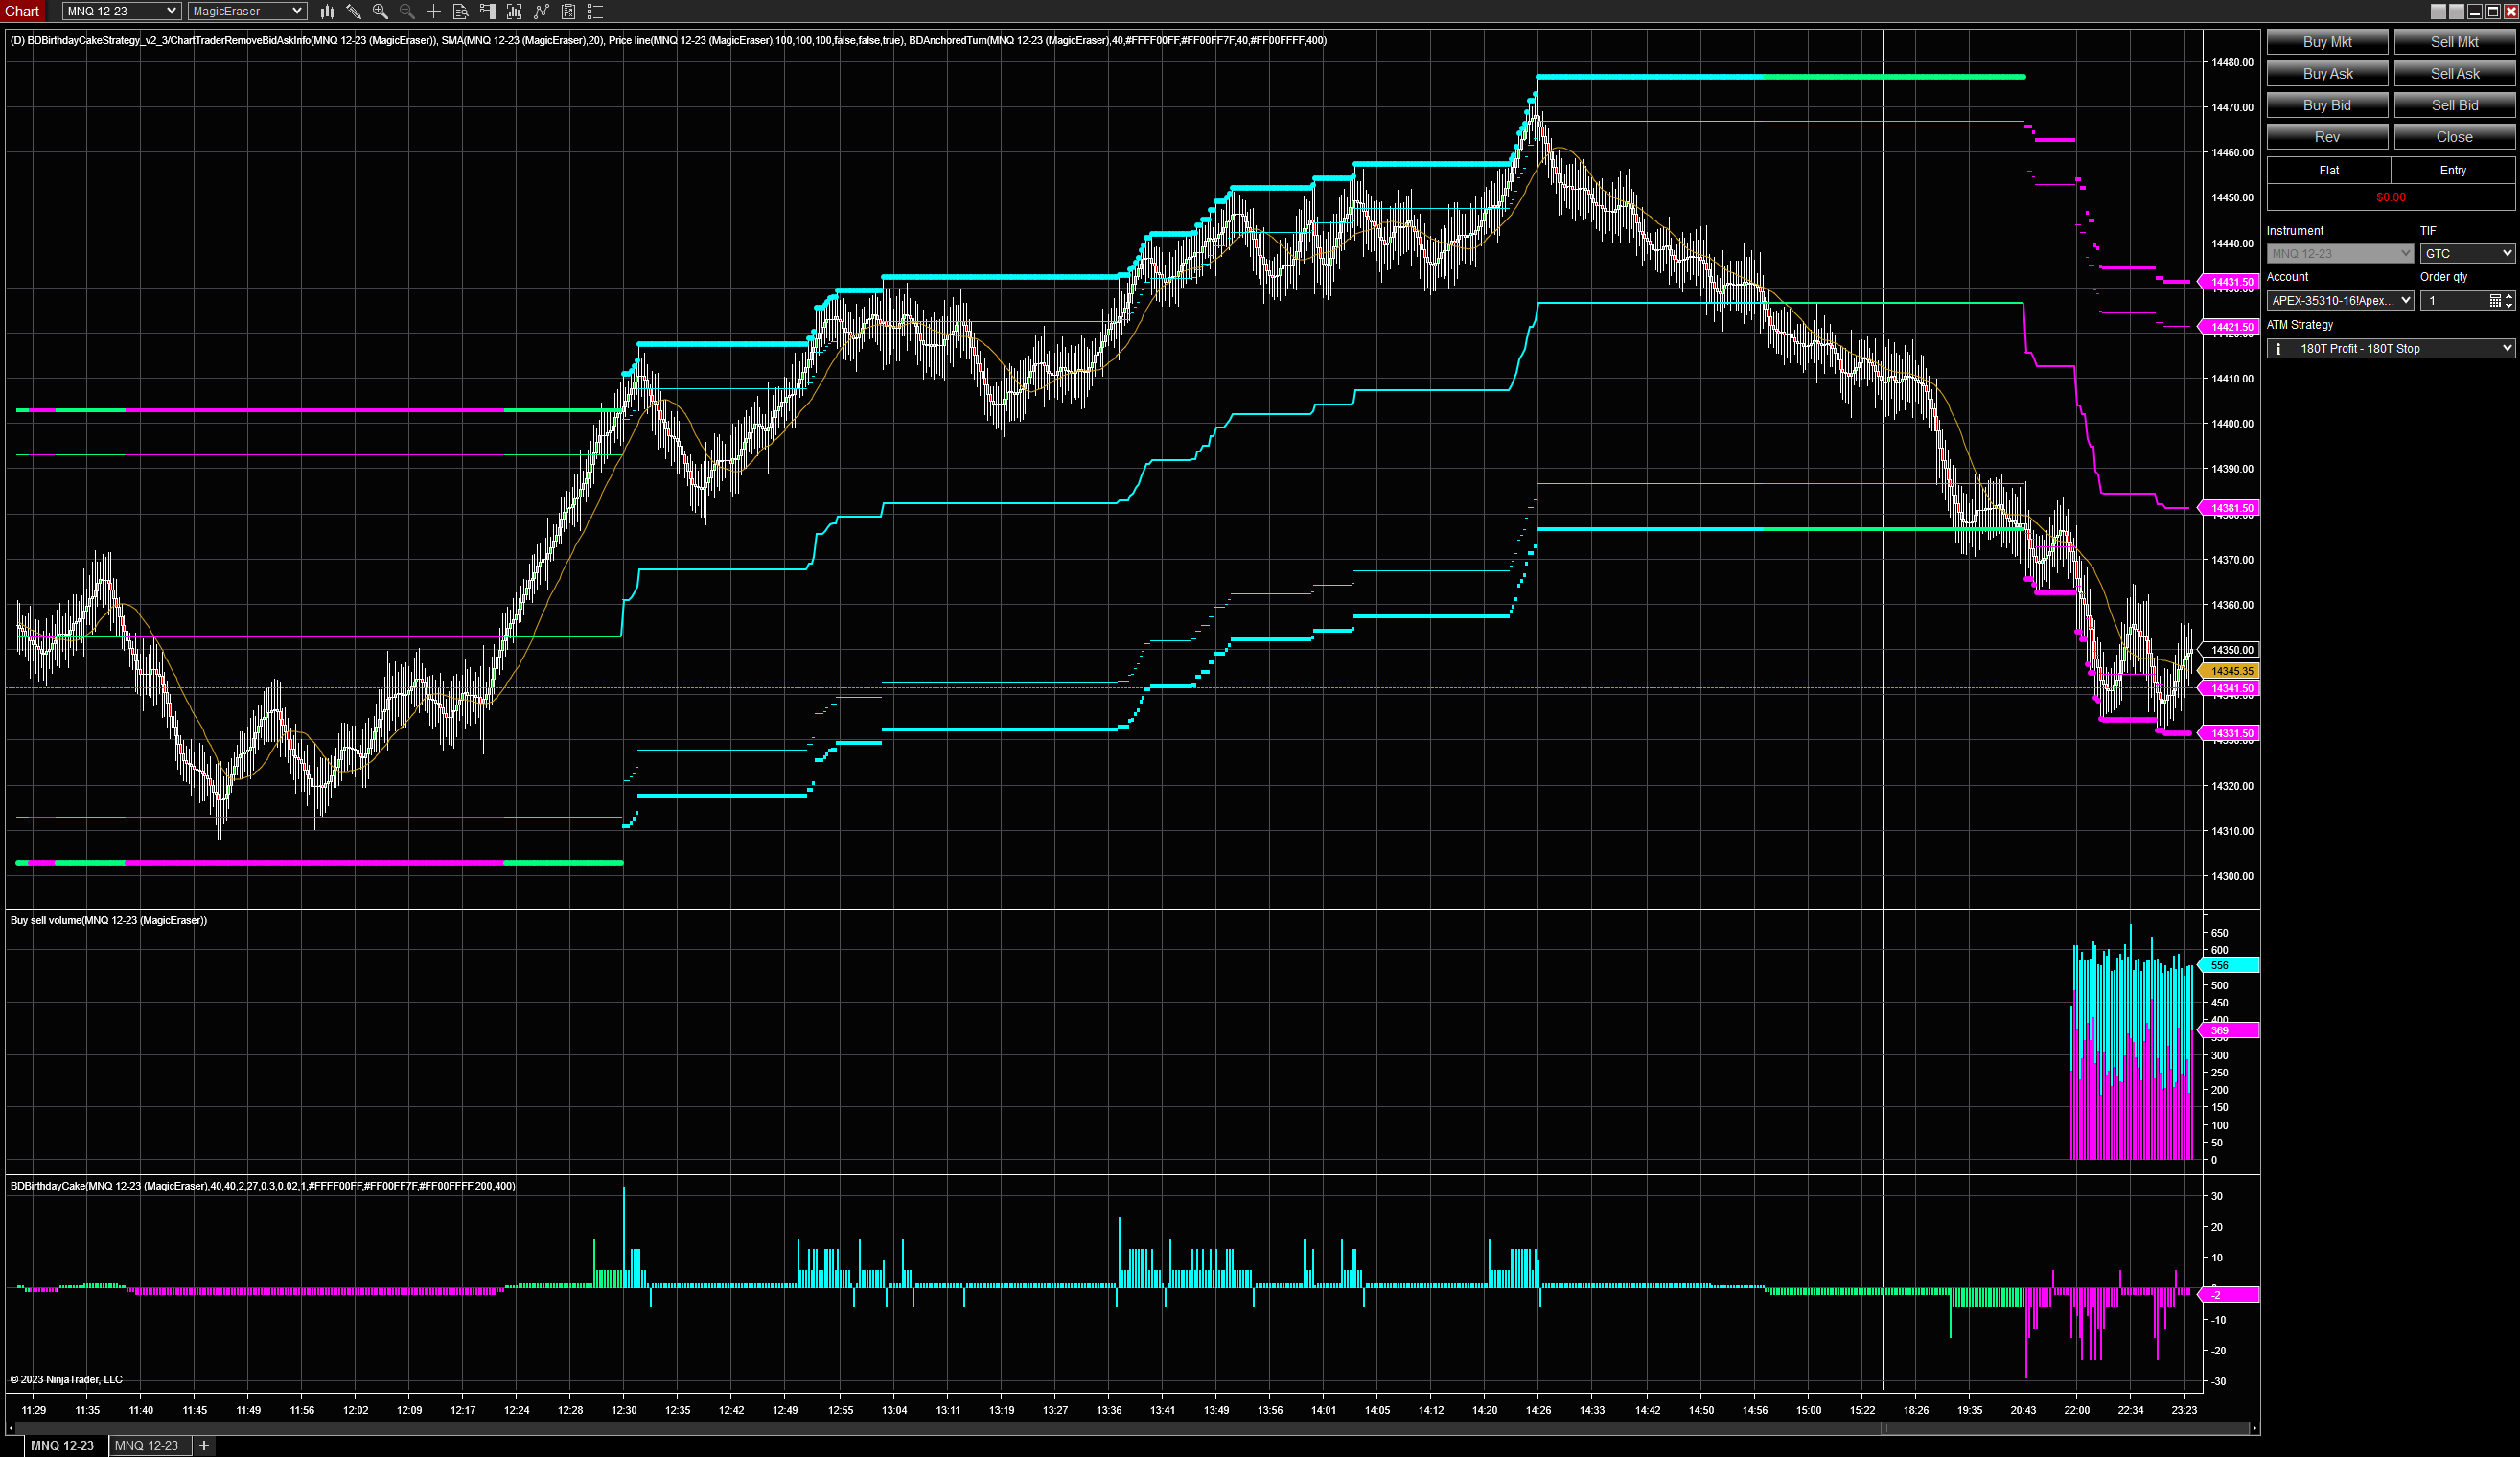
These bars reduce the number of reported crosses at a specific price due to wide spreads and fast DOM action. If your strategies require entries at a specific price you will find that these bars reduce the whipsaws in tick based bars.
PoshTrader is a fintech company based in Estonia that specializes in custom development and out-of-box solutions for traders. We convert, retain and increase the lifetime value of trading platforms. Our work focuses on enhancing the trader's experience and performance.
Elevate your trading to new heights with the platinum plan package. This comprehensive package includes all 9 NinjaTrader indicator modules and 13 NinjaTrader Drawing Tool modules from the gold plan, providing a solid foundation for market analysis and charting.
Know that you’re an amazing trader but finding the funds to get started is the one thing standing in your way? At UProfitTrader, we can help! Simply choose the size account you’d like, show us what you’ve got through our unique testing process, then start turning your passion into a profession.
Unlock the power of divergence in demand index with this simple to use translation of the interpretations of 20 different variants all combined in one. Often finds the exact peak of the day or week or month in real time. Newly released to join the other version on here. Works in any time frame.
December 2, 2024
Mastering Sideways Markets With Auction Bars and Range Projections
November 19, 2024
Enhancing Your Automated Trading System: Key Insights from Best Pro Trade
November 14, 2024
NinjaTrader New Ecosystem Tools: October 2024 Edition
Enter Email for Updates