A unique course with a specific, rule-based & mechanical/objective trading methodology. Designed to help traders identify entries & exits, define size, manage risk and control emotions when trading Equity Markets with their own characteristics & terminology. Get FREE access to the patented AutoUFOs®
The Easy E-mini E-book package details specific trade setups using standard indicators that are available with every download of NinjaTrader. The package comes pre-designed workspaces and templates, unlimited video library access & a 3-day chat room trial!
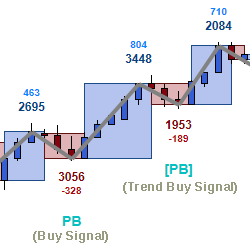
The Cycle Trend was developed as a way to evaluate trends with as little lag as possible compared to more conventional indicators such as the ADX or MACD. The idea behind this is that the price action and the shapes of the bars relative to each other is more accurate at defining the mood.
A trend following tool that can achieve exceptionally high risk/reward ratios when applied to suitable markets that trend well. Locks onto trends and does not let go until the trend ends. Not entirely suitable for novices. Strategy, paint bar and indicator included. Automated or manual operation.
This model balances four separate risk lenses that seek to generate alpha while moderating standard deviation over multi-year periods. Each risk lens is independently applied based on Alpha Vee's breakthrough fundamental momentum research. Equities are from small/mid cap universes.
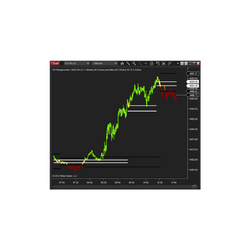
CB RangeLevels 2.0 can be used both for support and resistance and for breakout / momentum trading. The main idea is to keep you with the trend to the upside or downside. Trade in the direction of the painted bars using the middle bars as support and resistance.
Explore the vibrant world of NinjaTrader 8 Add Ons – a treasure trove of powerful tools crafted to elevate your trading game. Dive into an array of clocks, indicators and utilities designed to amplify your market analysis, fine-tune strategies and execute trades with precision.
MBoxWave Wyckoff Trading System is an order flow trading system using bid/offer and momentum to identify supply/demand imbalances. The system contains a series of indicators and signals designed to be used together to identify high probability trading opportunities, inspired by Wyckoff methodology.
The Volume Vector tool creates automatic volume profiling of price action swings. Increase trading consistency and see exactly where trades have been initiated!
Visualize the relationship between delta and volume with accurate statistical calculations on delta, ask, bid, and volume. This tool combines the power of data analysis with advanced charting, allowing you to see the most relevant market movements.
December 2, 2024
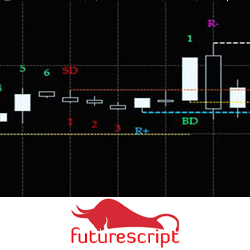
Mastering Sideways Markets With Auction Bars and Range Projections
November 19, 2024
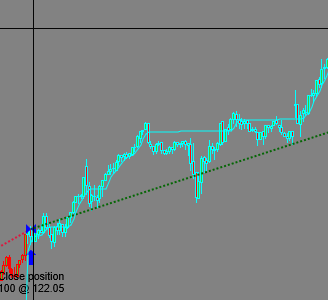
Enhancing Your Automated Trading System: Key Insights from Best Pro Trade
November 14, 2024
NinjaTrader New Ecosystem Tools: October 2024 Edition
Enter Email for Updates