Improve Your Trade is a fully-automated trading journal which records and tracks every trade you make automatically. It even adds screenshots of your trades, allowing you to focus on the important things like analyzing your trading performance!
Our automated trading system features scalping, swing trading, automatic entry & exit signals and price action-based trading. With no optimization required, the Best Pro trade systems are based on statistical analysis and algorithms based on advanced mathematical computations.
Quintalytics develops custom trading software for retail and institutional traders, brokers and other industry professionals for both NinjaTrader 7 and NinjaTrader 8. We have utilized and developed hundreds of custom indicators and trading strategies over 20 years. We can also modify and optimize.
The Diversified Trading System (DTS) brings traders the power of diversification, which can be applied to any trading style. Scalp, swing and trend trade on one instrument or multiple instruments. Only take the very best trade opportunities and ignore the rest. Get started today!
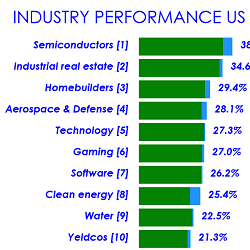
itcIndustryScanner is a NinjaTrader 8 indicator which scans all industry sectors of the US market and displays the strongest and weakest sectors. This screener is used to identify the best performing stocks in strong sectors. It requires a datafeed for NYSE & NASDAQ to analyze the market.
Custom Development Services are tailored for NinjaTrader users, offering bespoke solutions across markets. They provide real-time cryptocurrency data integration, custom indicators, strategies, and add-ons to optimize trading performance and profitability.
Innovation in Momentum: SPEARHEAD is a cutting-edge indicator for traders and investors. It compares the momentum of two instruments, with one being a custom synthetic instrument created by the user, incorporating up to seven assets like stocks, commodities, currencies, etc. Also in Spanish.
Master back-testing in algorithmic and quant trading with their dual course bundle. Learn essential techniques and advanced methods to optimize your trading strategies. Validate and optimize your trades with systematic, quantitative approaches. Start building your trading edge today! Sign up now!
The Ultimate Pivot Points™ (UPP) Indicator Package is the most advanced and extensive collection of “Pivot Points” Indicators available. It includes every “Pivot Point” method along with several innovative features — making it one of the most complete Support/Resistance indicators on the market!
See when & where aggressive traders act and track these levels over time with EDGE Zones. emoji trading's order flow analytics track real-time supply & demand. Is it continuing with potential to hold, or exhausting with potential to break? Get started with a free 7-day trial today!
December 2, 2024
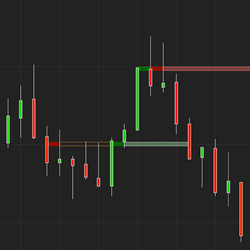
Mastering Sideways Markets With Auction Bars and Range Projections
November 19, 2024
Enhancing Your Automated Trading System: Key Insights from Best Pro Trade
November 14, 2024
NinjaTrader New Ecosystem Tools: October 2024 Edition
Enter Email for Updates
 from Indicator Warehouse.png)