This strategy is fully automatic with many inputs for backtesting. In today’s volatile market, it is not a standalone system. It was created to give the trader real, automated insights regarding money management, max trades per day, trailing stops, profit targets, etc. Now you can know.
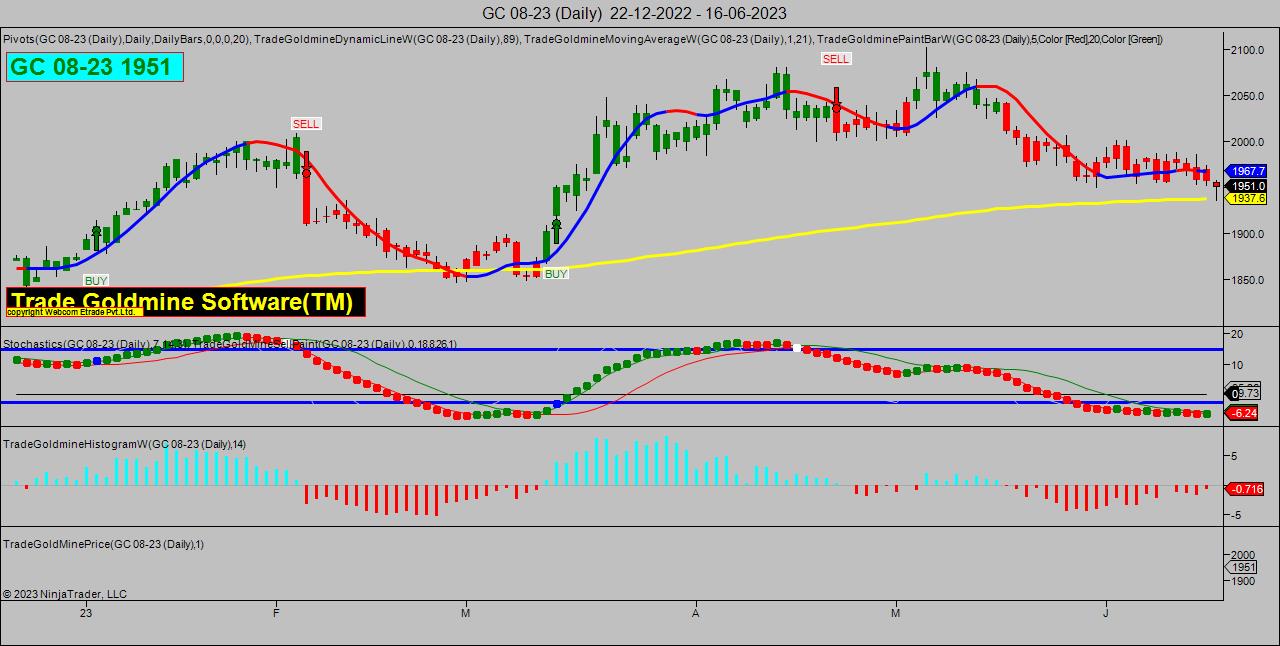
GOLDMINE NINJA TECHNIQUE software is a technical analysis tool that gives user-friendly BUY-SELL signals to traders and helps find perfect resistance & support levels in order to trade more effectively.
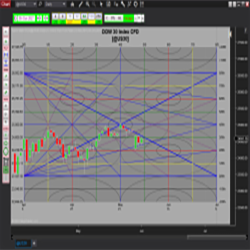
Samri Math Price-in-Time is a comprehensive tool for traders using Murrey Math methodology. This indicator calculates not just PRICE levels, but also sets the price in TIME. Easily switch between time frames (day or minute only) with the user-friendly interface.
The Lighthouse Trading strategy works fully automatically in the futures market. Besides trading in different markets simultaneously, you can configure it in distinct ways in each one of them. The algorithm analyses time and sales, volume, rhythm and acceleration in real time.
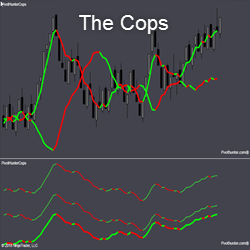
THE COPS includes the duo, Dog and Sheriff, working in close harmony. Dog swings wide when The Convict begins to run. When Dog is narrow, traders wait for the separation before considering a market entry. The COPS in the bottom panel measure momentum at 3 levels.
This tool is the ultimate solution to help with your discipline and money management. This will display PNL in ticks or points on your chart, halt your ability to continue trading once you hit your risk limit and will ensure all orders are flattened before halting your trading. Free 7 day trial.
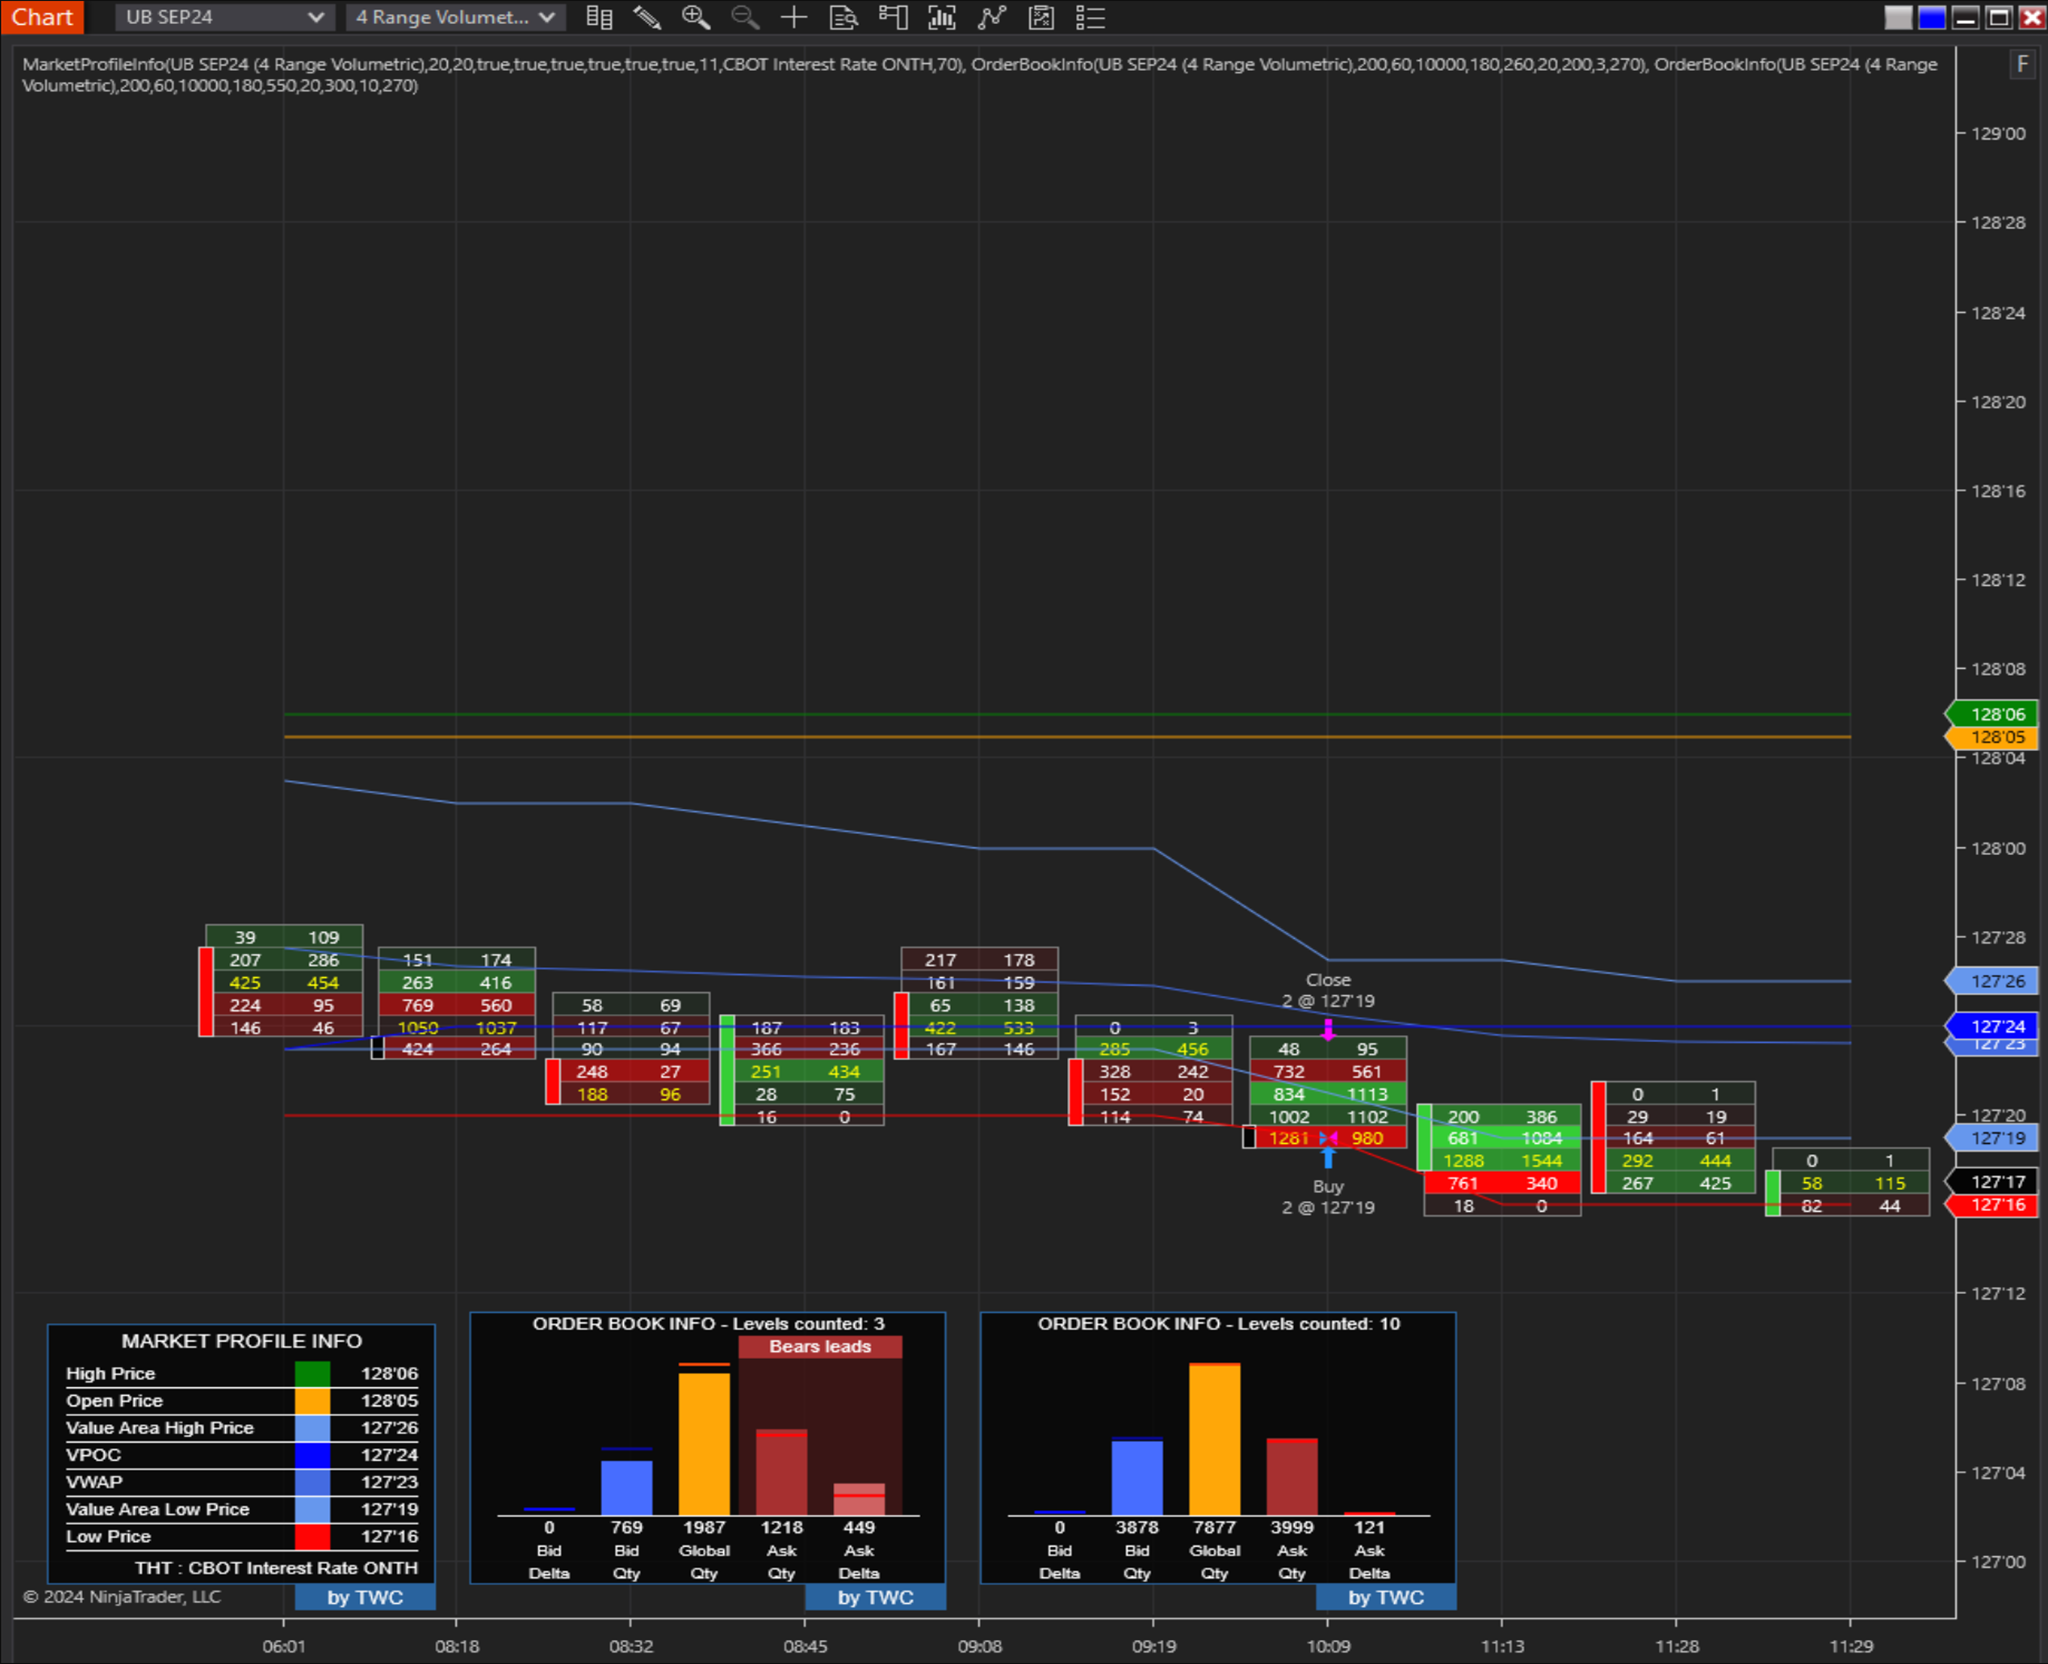
The power of TWC Market Profile Info and TWC Order Book Info. Traders gain a clear understanding of market dynamics. The Market Profile tool provides critical insights into key market points and trends, while the Order Book tool offers real-time visualization of order flow dynamics.
FXAN delivers a full approach that combines institutional tools, education, and professional support to help you trade with confidence. Their algorithms and training program have been developed by trading experts who’ve dominated markets for years.
Free trading psychology masterclass. Learn the complete trading psychology system to overcome destructive trading habits and reach pro-level consistency in as little as 8 weeks (even if you are starting with zero willpower and breaking your rules every time you trade). Register today!
The MAutoFloorCeiling indicator is the culmination of over 2 years of research to determine support / resistance levels automatically. The heart of it utilizes a powerful algorithm based on Wyckoffian concepts of waves, volume, and price levels to gain insight on potential entry points.
December 2, 2024
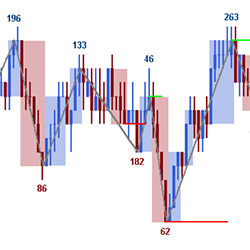
Mastering Sideways Markets With Auction Bars and Range Projections
November 19, 2024
Enhancing Your Automated Trading System: Key Insights from Best Pro Trade
November 14, 2024
NinjaTrader New Ecosystem Tools: October 2024 Edition
Enter Email for Updates