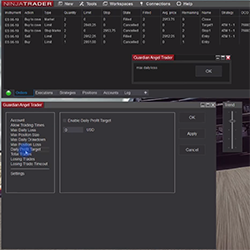
Guardian Angel Trader is a risk management tool for NinjaTrader 8 designed to help traders control trading times, max daily loss, position size, max daily drawdown, max position loss, daily profit targets, total trades, losing trades and losing trade timeout. Gain consistency in your trading!
Indonesian-speaking. This channel is a place to learn forex, crypto and stock trading using ICT methods. Make daily analysis, design trading plans correctly and measurably.
Pinnacle Quant offers custom, confidential NinjaScript programming and consulting services. Our services are offered for serious traders, CTAs, and hedge funds. Take advantage of our 20+ years of development and trading expertise. One-on-one consulting is available.
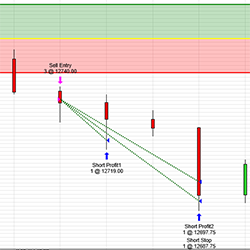
This strategy will trade the opening range and provide targets and stops. It will also trail after each target is hit. The trail and stop levels can be customized as well as the targets.
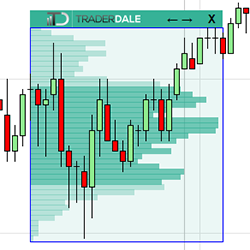
TD’s Flexible Volume Profile helps to reveal institutional trading activity and identifies the strongest support and resistance zones. The use of tick volume data makes it extremely precise leading to potential entries. It is easy to learn, simple to use, and extremely intuitive.
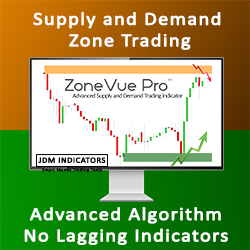
ZoneVue Pro, an advanced Supply & Demand Indicator, giving you the edge you've been looking for! Identify quality zones from price action to order flow, identifying pending orders from banks and intuitions. No lagging indicators. Trade like a sniper. Transform your trading!
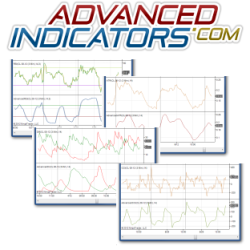
Advanced Indicators are some of the most advanced indicators currently available on the market! Get cutting-edge trading tools - encompassing years of experience in financial market research, engineering, mathematics, a.i., and data science. These unique pro tools not available anywhere else!
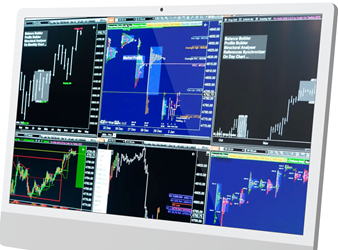
Elevate your trading with the ultimate toolset. The gold plan includes 9 NinjaTrader indicator modules and 13 NinjaTrader drawing tool modules. Seamlessly communicate between market profile and other charts. Utilize the top down approach analysis for daily, weekly, monthly and short-term charts.
Trade with the best conditions in order to become an extraordinary trader, follow the risk management rules and reach your target in as little as 10 days. Once you have completed the target, we will connect you with one of our funding partners.
Momentum indicators work best when indicating an overbought or oversold condition within a trend. Expect a reversal back in the direction of the trend when IAMomentum reaches an extreme level while IATrend is alerting followers of that trend. Together, these two indicators highlight price reversals.
December 2, 2024
Mastering Sideways Markets With Auction Bars and Range Projections
November 19, 2024
Enhancing Your Automated Trading System: Key Insights from Best Pro Trade
November 14, 2024
NinjaTrader New Ecosystem Tools: October 2024 Edition
Enter Email for Updates