With these trader support plans you will have everything you need to carry out your operations in a professional way. They put at your disposal the latest technology on algorithmic trading. Proven software used by professional traders.
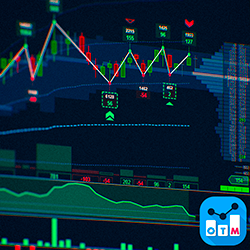
OTM is an advanced suite of delta and volume trading tools. It includes Swing, Delta Micro, Delta Bar, Cumulative Delta, Volume Profile, VWAP, and Timer. OTM provides real-time insights on buying and selling strength, synchronizing indicators for accurate trades. Improve your trading with OTM.
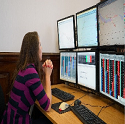
This workshop will help you decide if trading could be for you. It demonstrates all aspects of trading - managing risk, trading techniques, technical analysis, trading psychology, creating a trading plan and what to include. Join in with your laptop or computer.
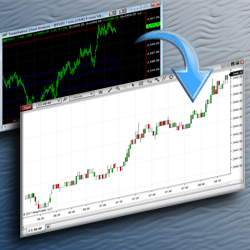
Moore Tech, LLC has over 15 years of experience working with TradeStation, and have converted hundreds of indicators and strategies to be compatible with NinjaTrader. Contact them today to receive a free estimate for having your code converted from EasyLanguage to NinjaScript.
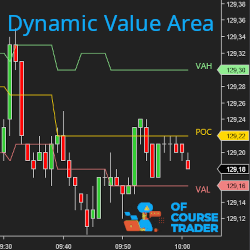
The Dynamic Value Area allows you to visualize in real time the evolution of the POC, VAL, VAH levels corresponding to the most traded value area. It also gives you historical levels. Its NinjaScript API will allow you to integrate the value area into your own indicators and strategies.
Emet Trading Solutions is a team of experienced programmers focused on trading. They offer strategy and indicator conversion from NinjaTrader 7 to NinjaTrader 8, or from NinjaTrader 8 to NinjaTrader 7. Their services include an individual approach and ongoing technical support. Get a free quote!
TradeTrend© provides entry & exit signals including trailing stop levels for stocks, futures and forex. This automated strategy can be used to make more informed and confident decisions for a wide range of options strategies and helps traders stay on the right side of the market & momentum.
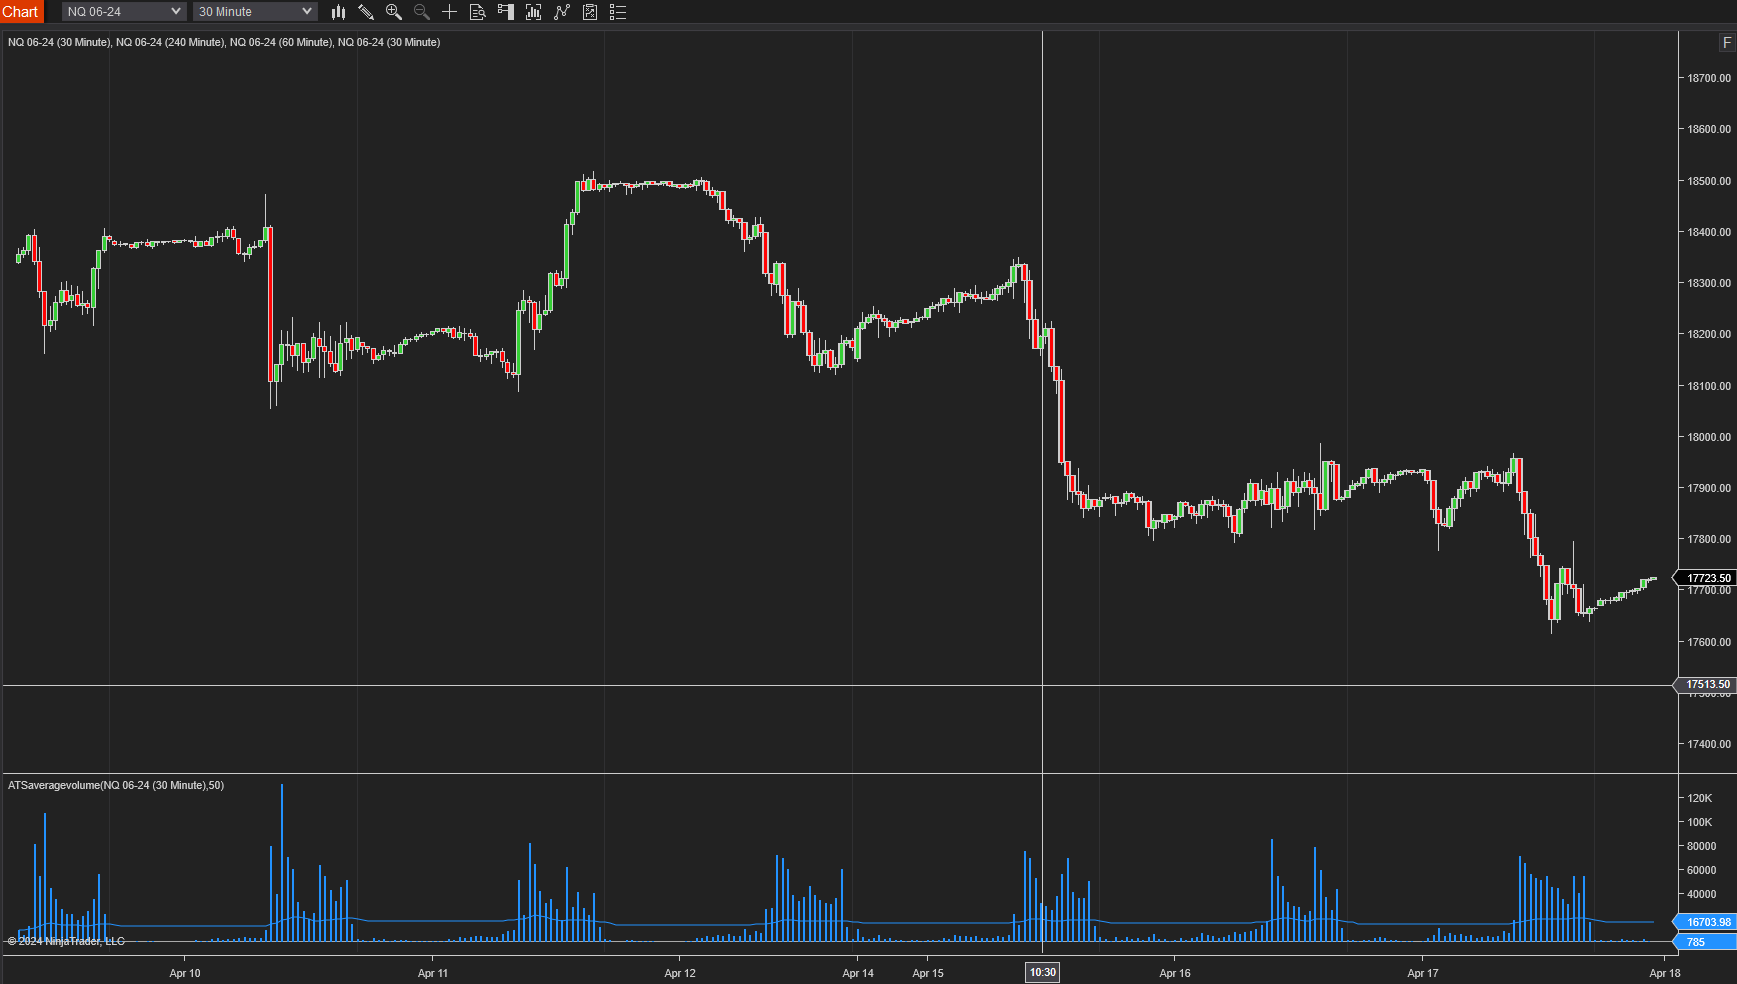
This indicator plots a 50-bar average of the volume overlaid on the current volume. You can change the number of bars used to calculate the average.
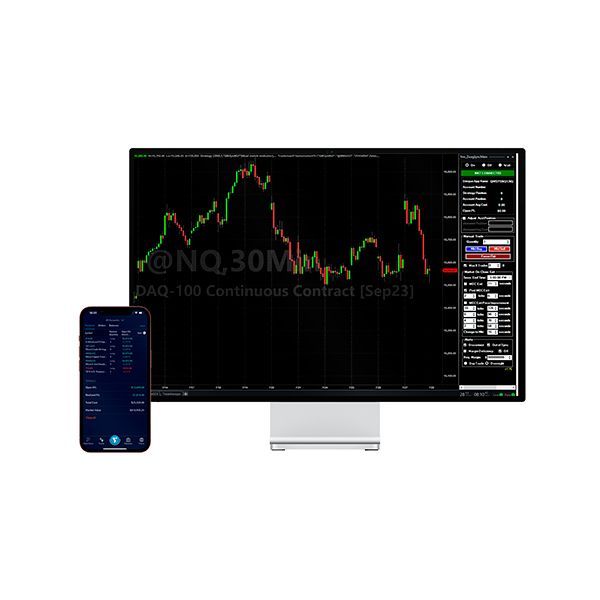
This system will take you through the process of how to "risk 1 to make 2" that professional traders utilize to increase their profitability and have consistent months, quarters and years. The system incorporates philosophies found in "Trading in the Zone" by Mark Douglas.
The indicator employs a proprietary algorithm, generating highly reliable signals in trending markets, leading to more confident trade decisions. The indicator's clouds move dynamically in tandem with market trends, offering a visually comfortable representation of market conditions.
December 2, 2024
Mastering Sideways Markets With Auction Bars and Range Projections
November 19, 2024
Enhancing Your Automated Trading System: Key Insights from Best Pro Trade
November 14, 2024
NinjaTrader New Ecosystem Tools: October 2024 Edition
Enter Email for Updates