The Anchored VWAP package for NinjaTrader 8 includes the Anchored VWAP drawing tool and indicator. With one click, add a VWAP from any bar on your chart. Using the Anchored VWAP indicator, attach orders to the VWAP to automate your trade entry.
A unique course with a specific, rule-based & mechanical/objective trading methodology. Designed to help traders identify entries & exits, define size, manage risk and control emotions when trading Forex Markets with their own characteristics & terminology. Get FREE access to the patented AutoUFOs®.
The Linear Regression Channel (LRC) is designed to truly detect when prices are overbought or oversold. Different than other LRC indicators, the width of the Stealth Traders LRC channel is based on a proprietary formula, designed to pinpoint opportune entry and exit signals. Upgrade Your LRC Today!
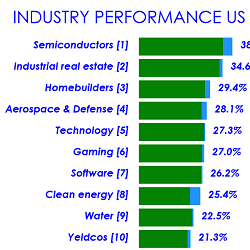
itcIndustryScanner is a NinjaTrader 8 indicator which scans all industry sectors of the US market and displays the strongest and weakest sectors. This screener is used to identify the best performing stocks in strong sectors. It requires a datafeed for NYSE & NASDAQ to analyze the market.
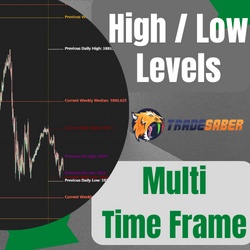
This indicator marks the High/Low median of the previous candle in various time frames. Options include: 1 min, 5 min, 15 min, 30 min, 60 min, 240 min, previous daily, current daily. previous weekly and current weekly.
You know how important “to-the-tick” accuracy is, missing an entry by 1 tick or an exit by 1 tick can make All the difference in your P and L. Quaderr aims to find the Real Support and the Real resistance using volume profile. Every tick counts.
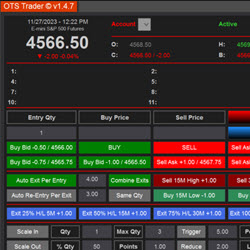
Uniquely streamlines your daily trading tasks, automating processes that would otherwise require manual effort. Organized into four key sections — first entry, second entries, auto stops and auto exits. Plus more.
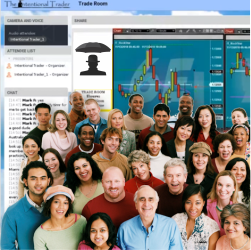
Day trading six futures instruments every day from 9am until 12pm Eastern time. Watch the Intentional Trader system in action in real time. Listen to a trade room moderator call out trades before entering them. They have been trading the same system and indicators since 2009!
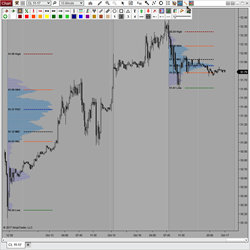
VPD is a custom drawing tool that dynamically draws volume profiles anywhere on your chart. It features 3 Modes of Calculation and displays 6 Levels of Significance (VPOC, VA's, High/Low/Mid) as well as a profile summary. It utilizes a unique context menu and is global drawing & template capable.
A unique course with a specific, rule-based & mechanical/objective trading methodology. Designed to help traders identify entries & exits, define size, manage risk and control emotions when trading Equity Markets with their own characteristics & terminology. Get FREE access to the patented AutoUFOs®
December 2, 2024
Mastering Sideways Markets With Auction Bars and Range Projections
November 19, 2024
Enhancing Your Automated Trading System: Key Insights from Best Pro Trade
November 14, 2024
NinjaTrader New Ecosystem Tools: October 2024 Edition
Enter Email for Updates