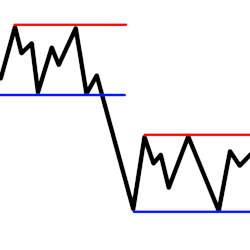
This savvy tool is for any intraday trader who draws lines and prizes accuracy when plotting, templating and reviewing line break information across multiple intraday timeframes. Our template tool also features the 5 standard next-gen and time saving features of the CT_Signature Fan Series.
Created to help aid momentum-style charting in finding support and resistance lines. It was specifically made for the ES when plotted with tick bars. This tool may help cut down on chart preparation time or get your chart caught back up if busy multi-tasking.
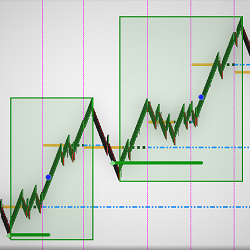
An innovative way to analyze trading opportunities. Contextual trading keeps traders on the right side of the market. Qualified supply/demand zones work in sync with institutional traders. Enter trades with the shift of momentum. Learn and trade. Schedule a free consultation with the coach.
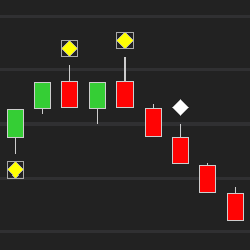
Using Renko/range/tick/volume bars? Optimal Speed analyses the length of time a bar took to form in order to highlight possible congestion areas. Instantly see the slowest bar of the session, slower-than-average bars, crawl bars and the slowest up and down bars of the day. Strategy compatible.
Professional-grade, lightning-fast trading system that self-adjusts to the current volatility conditions as it trades the re-emergence of momentum on modern financial markets. Available in standalone and Bloodhound versions. Built rock-solid for NT8.
This trading book is for the those traders struggling with psychology and entries with practical examples provided.
With a potential of 1 trade per day, this system is automated from start to finish & designed to be monitored in some capacity. If you can remotely access a computer with the right software, then you can monitor these automated trades from the golf course (with a strong cell signal).
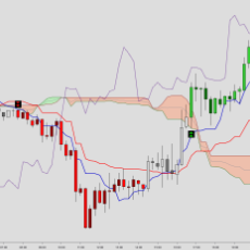
The Ichimoku Kinko Hyo, also known as the Ichimoku Cloud, is a versatile indicator that defines support / resistance, trend direction, momentum and trade signals. One can also think of this indicator displaying momentum in 5 separate time-frames.
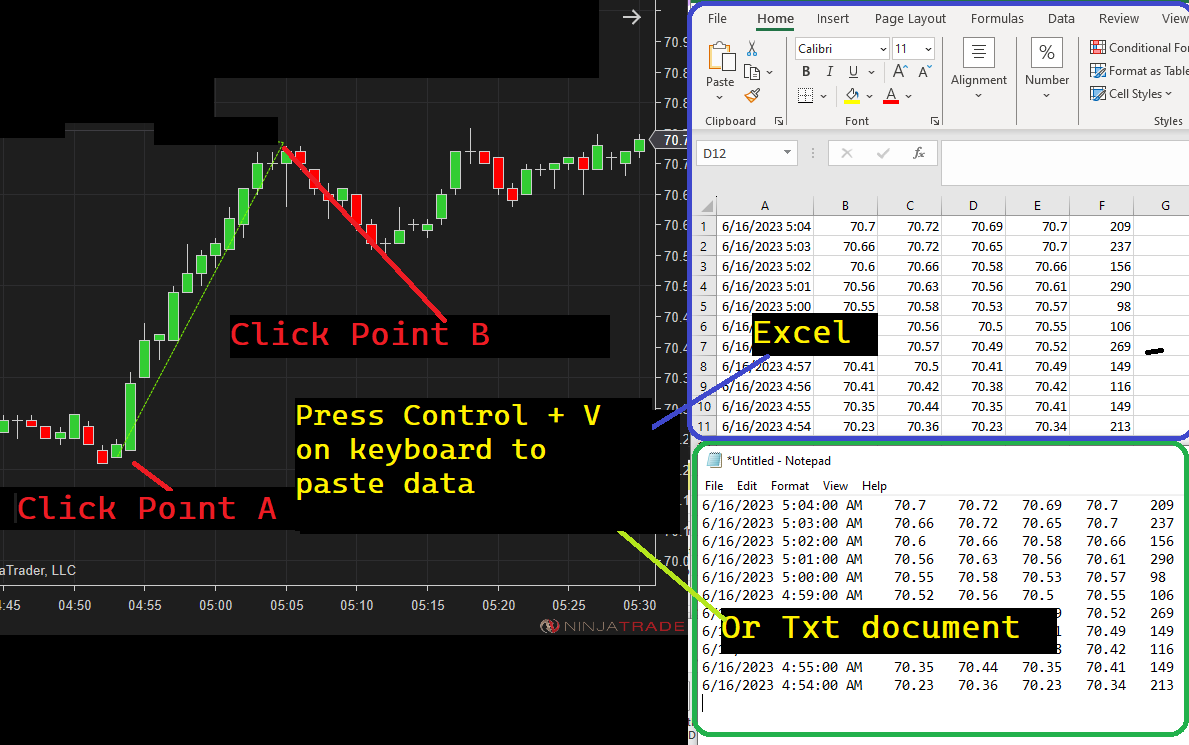
This innovative tool allows you to select any two points on your chart – effortlessly copying the corresponding bar values – and paste them directly into Excel or a text document using the familiar Ctrl+V shortcut.
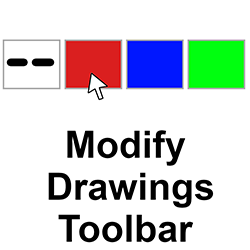
Trying to change line types and colors requires opening the properties box. It's also tricky to set a line or ray to be exactly horizontal. This toolbar contains various tools to help with those frequent property changes. It will even move your object endpoint to the chart's end.
December 2, 2024
Mastering Sideways Markets With Auction Bars and Range Projections
November 19, 2024
Enhancing Your Automated Trading System: Key Insights from Best Pro Trade
November 14, 2024
NinjaTrader New Ecosystem Tools: October 2024 Edition
Enter Email for Updates