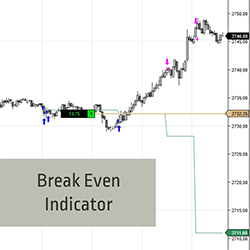
Want to hold on to trades longer? The Break Even indicator calculates profits taken into the average price of the remaining position. See the Break Even line move away from price & gain additional confidence to remain in your trade! It works for both long & short trades. Start your 2-week trial now!
The Oil Trading Room is a product of Robbins World Cup Champion Trader Rob Mitchell. It has a unique Scientific approach with Trading Signals, Indicator applications using Market Profile, Price Action, Order Flow, Momentum, Order Flow Momentum, Support Resistance, Market Mapping and more.
The ATR Stop is a simple but powerful tool to help the trader stay in a position longer and with greater confidence. Employs a proprietary “filter” to eliminate “false positives.” PTG ATR Stop Indicator is your confidence builder. Ask about PTG's Auto-Trade Assistant (ATA) Strategy.
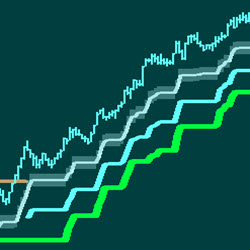
The indicator employs a proprietary algorithm, generating highly reliable signals in trending markets, leading to more confident trade decisions. The indicator's clouds move dynamically in tandem with market trends, offering a visually comfortable representation of market conditions.
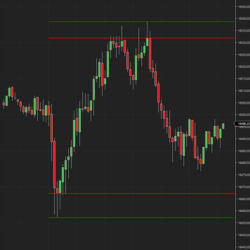
Elevate your trading strategy with the DR/iDR Indicator for NinjaTrader: Your essential tool for identifying key price levels. This advanced indicator displays both the Daily Range and the Implied Daily Range directly on your trading charts, providing crucial insights.
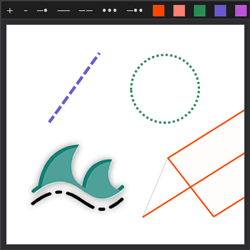
This indicator allows the user to change the color, stroke style and stroke size of drawn objects on the fly without having to dig through various menus. This increases application functionality and user charting efficiency.
TradeTrend© provides entry & exit signals including trailing stop levels for stocks, futures and forex. This automated strategy can be used to make more informed and confident decisions for a wide range of options strategies and helps traders stay on the right side of the market & momentum.
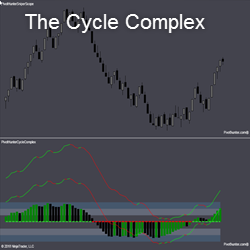
THE CYCLE COMPLEX measures price momentum at 4 levels: the histogram, 2 lines of higher sensitivity, and a dotted bull bear line. When the histogram is in the bands and turns, the pivot is often stronger. If the histogram is above or below the bands, the strength is even greater.
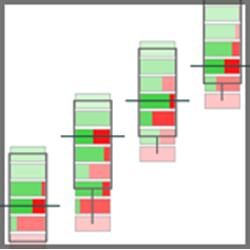
LogikBarProfiler is a feature-rich bar volume / tick / price distribution heads-up display analysis tool. It displays data computed within each bar, as well as buyer v. seller distribution at price levels. This combines the usefulness of POC, delta, and activity analysis into one intuitive tool.
Advanced Indicators are some of the most advanced indicators currently available on the market! Get cutting-edge trading tools - encompassing years of experience in financial market research, engineering, mathematics, a.i., and data science. These unique pro tools not available anywhere else!
December 2, 2024
Mastering Sideways Markets With Auction Bars and Range Projections
November 19, 2024
Enhancing Your Automated Trading System: Key Insights from Best Pro Trade
November 14, 2024
NinjaTrader New Ecosystem Tools: October 2024 Edition
Enter Email for Updates