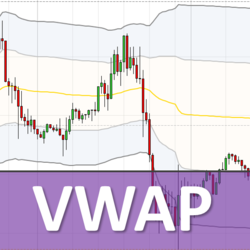
VWAP shows S/R levels, which the majority of institutional algorithms use. It works with all trading instruments (Forex, Futures, Indexes, Commodities, Stocks) and time frames (day trading, swing trading, position trading). It includes VWAP Training Video Course and VWAP trading setups.
The Quantum Dynamic Volatility indicator paints volatility as price action unfolds - no more guesswork, no more nasty shocks. Watch and wait, then trade with this safety-first indicator!
There are dozens of free RSI indicators available, but only the Ultimate RSI has all of their features and options rolled into one powerful trading tool! It also comes with the “RSI: The Day Trader’s Secret Weapon” guidebook explaining different ways to trade with the RSI. Get it now for free!
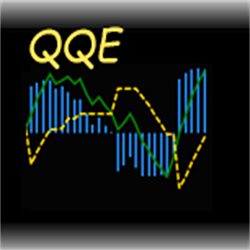
ATS QQE is a powerful Quantitative Qualitative Estimation (QQE) indicator with additional options which make it more versatile.
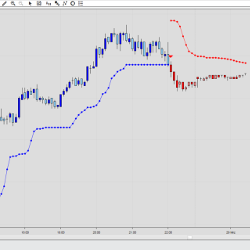
The SuperTrend U11 is a stop and reverse (SAR) indicator that trails price action. The trailing stop adjusts to both trading prices and volatility. When volatility is high, the trailing stop is further away from prices. When volatility is low, the trailing stop moves closer to prices.
Actual Trading are professional traders and experts in market analysis, providing personalized training adapted to the needs of the customer. NinjaScript programming and development on demand. Exclusive indicators and systems for retail, professional, or institutional trading, and much more.
Track the open and close sessions of up to four different market times on your chart. A marker plots offset above and below the bar that corresponds to your time setting, which are all parameters that the user custom configures in the indicator properties window.
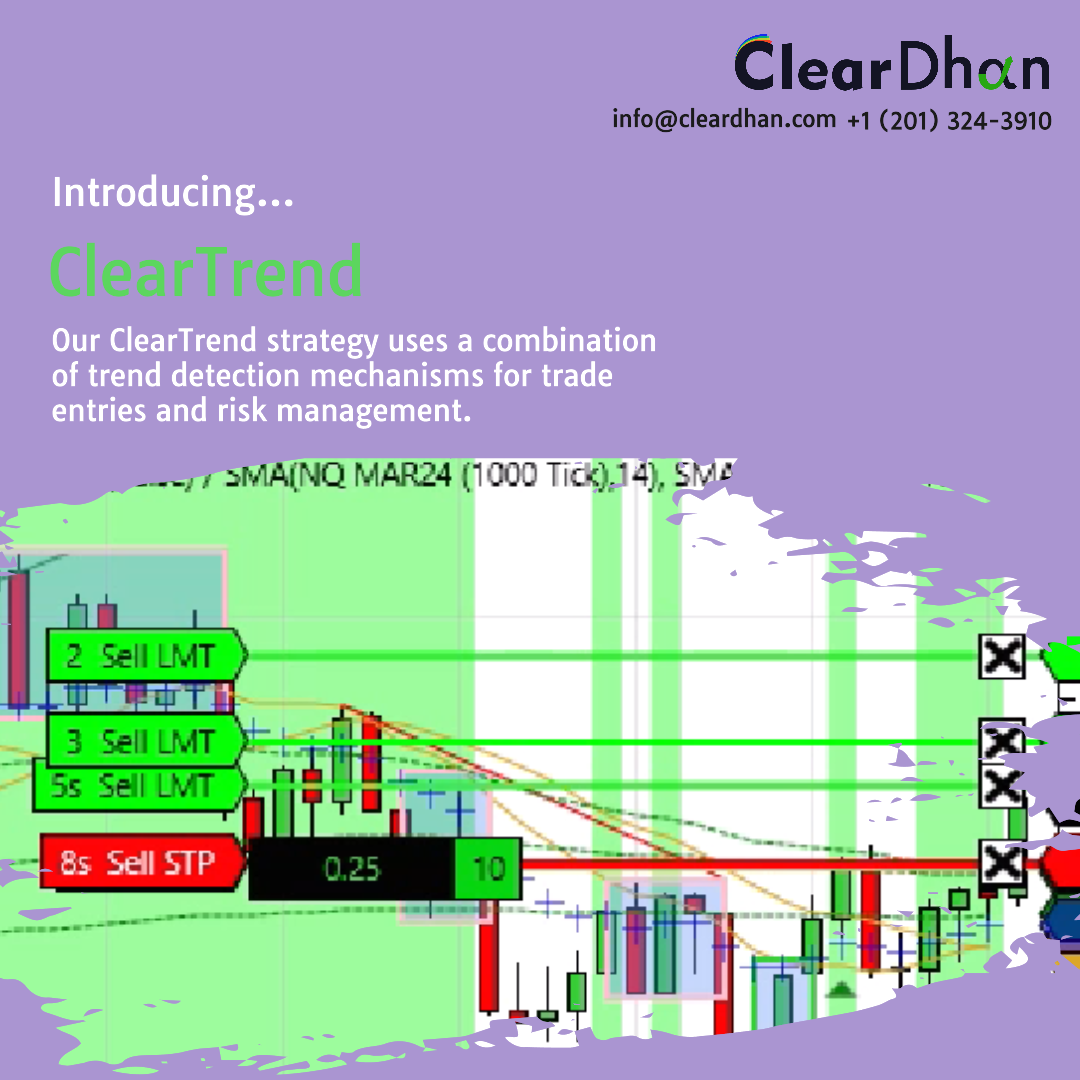
ClearTrend uses a combination of trend detection mechanisms for trade entries and risk management. Works to identify optimal trades using real-time time responsiveness to opportunities using trend strength. Available as a fully automated strategy or as an indicator form. Five-day free trial.
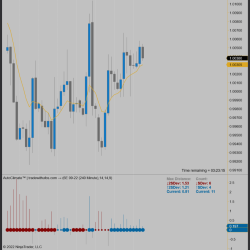
Intelligent technology assesses the market environment from a statistical point of view in order to answer the key questions before a trade: “Which side of the market should I be in?”, “Should I be a buyer or a seller?”, or “Should I simply avoid trading and not trade at all?”
The Angels and Demons Indicator shows current and past support and resistance levels. It can be applied to multiple time frames, making it suitable for swing and position traders as well as day traders. Easily visualize important price levels where longs and shorts attempt their defense!
December 2, 2024
Mastering Sideways Markets With Auction Bars and Range Projections
November 19, 2024
Enhancing Your Automated Trading System: Key Insights from Best Pro Trade
November 14, 2024
NinjaTrader New Ecosystem Tools: October 2024 Edition
Enter Email for Updates