This is the ultimate mean Renko version (with wicks) for NinjaTrader 8. It removes noise and helps visualize trends. ninZaRenko can be used for charting, trading, backtesting, and programming. It is trusted and loved by thousands of traders worldwide. Download free now!
For new or current traders who wish to learn what it takes to gain knowledge and confidence to become more consistent in their trading, this course includes the following sections: Price Action Mastery Overview, Price Action Q&A Recorded Webinar, Understanding Market Sentiment & a Trader Assessment.
Do you want to overcome the challenges that leave traders feeling overwhelmed and uncertain? Have you tried to solve that losing pattern in your trading behavior but failed? This e-course, based on the latest neuroscience, will solve the mystery of your trading mind versus the collective market.
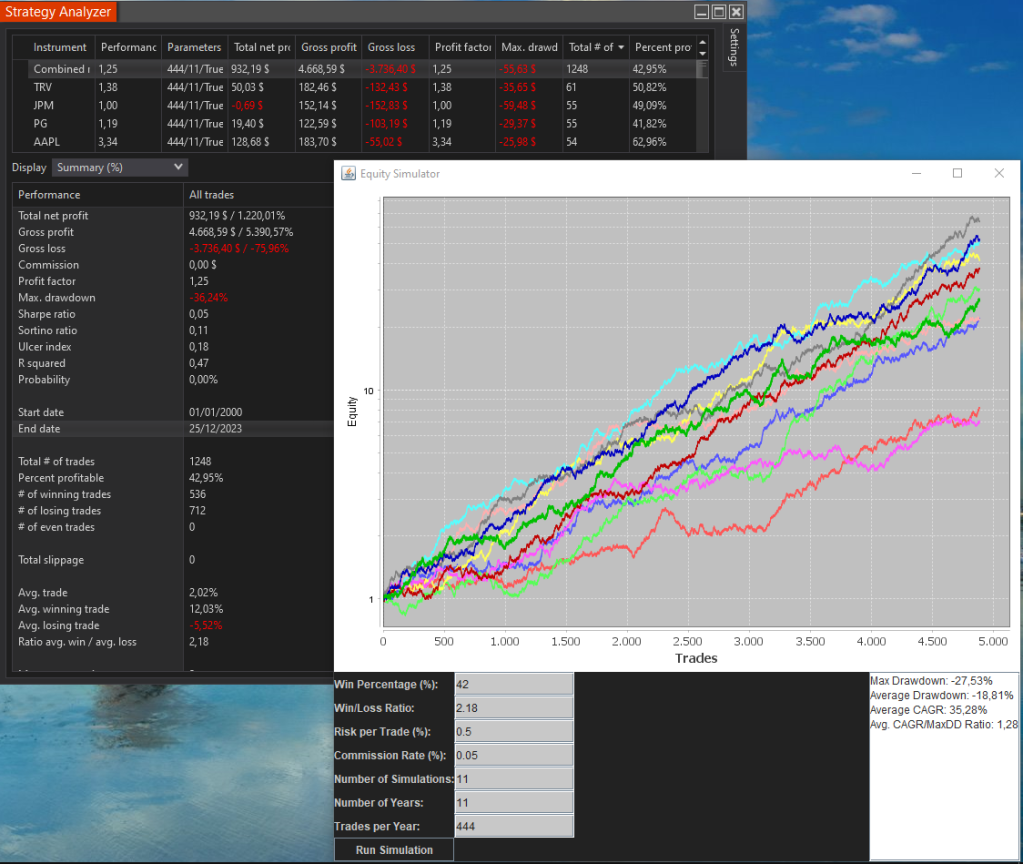
We can take the parameters from the Strategy Analyzer summary and generate a forecast for the desired numbers of trades and years. We can estimate our optimal risk per trade.
Bstrader-automatic is a powerful trend following automated trading system. It has customizable parameters, different position sizing methods, fixed size, equity percentage, atr, price percentage, ATR Trailing Stop, Market Money Scale In and Scale Out, Volatility Compass, Daily loss limit and more.
Join this team of professional traders and mentors as they identify trades in real time (US / open & close NQ & ES).
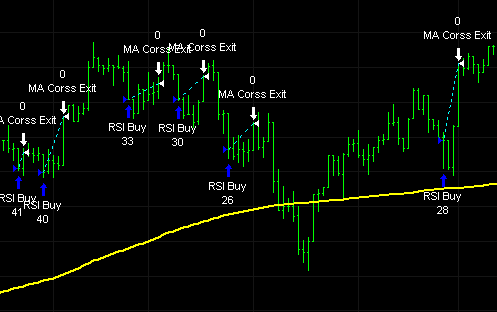
The Connors RSI2 strategy is a popular and well-known trading strategy developed by Larry Connors. It is designed to identify short-term overbought or oversold conditions in a market and exploit potential mean-reversion opportunities.
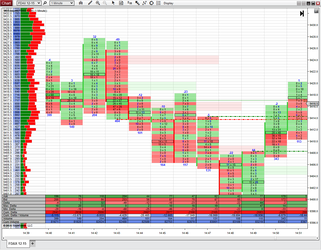
Pure and simple footprint (aka market profile or order flow chart) and volume profile chart add-on for NinjaTrader. Displays bid and ask volume traded at each price at each bar. Alternative charts – range, volume and tick charts - are also fully supported.
A traditional Gann Fan with upgraded features. Save time with the Speedkey onscreen task command buttons. Derive better leading edge, price action information from your Gann Analysis, including support and resistance identification and real-time price momentum information. Contact for a free trial.
Simplify trading screens, and be the first to spot the trend. HeatMap is a tool that informs you when futures, forex or equities markets are all correlated in the same direction, or mixed. Know at a glance when follow through is high, or when the markets are sideways. Get the HeatMap now!
December 2, 2024
Mastering Sideways Markets With Auction Bars and Range Projections
November 19, 2024
Enhancing Your Automated Trading System: Key Insights from Best Pro Trade
November 14, 2024
NinjaTrader New Ecosystem Tools: October 2024 Edition
Enter Email for Updates