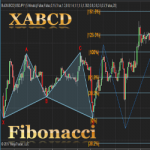
XABCD 5-point chart patterns are very common and popular in technical analysis. As the name suggests, XABCD pattern has 5 points and 4 legs formed by those 5 points. The concept of the XABCD 5-point pattern can be understood on a chart.
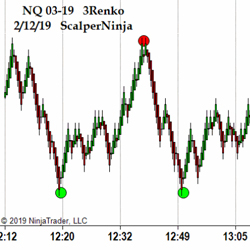
Pick from 8 different bar charts, offering features found nowhere else. Customized renko, range, tick, and time-based charts are available. Most charts have unique chart styles included (classic candle, price action, and xray). Get a free trial now!
IAStealth signals the entry when the shorter time frame momentum has reversed back in the direction of the trend. More important is to know when the longer time frame momentum is showing signs of reversing. IAStealth alerts the shorter time frame after IAMomentum/IATrend alert the longer time frame.
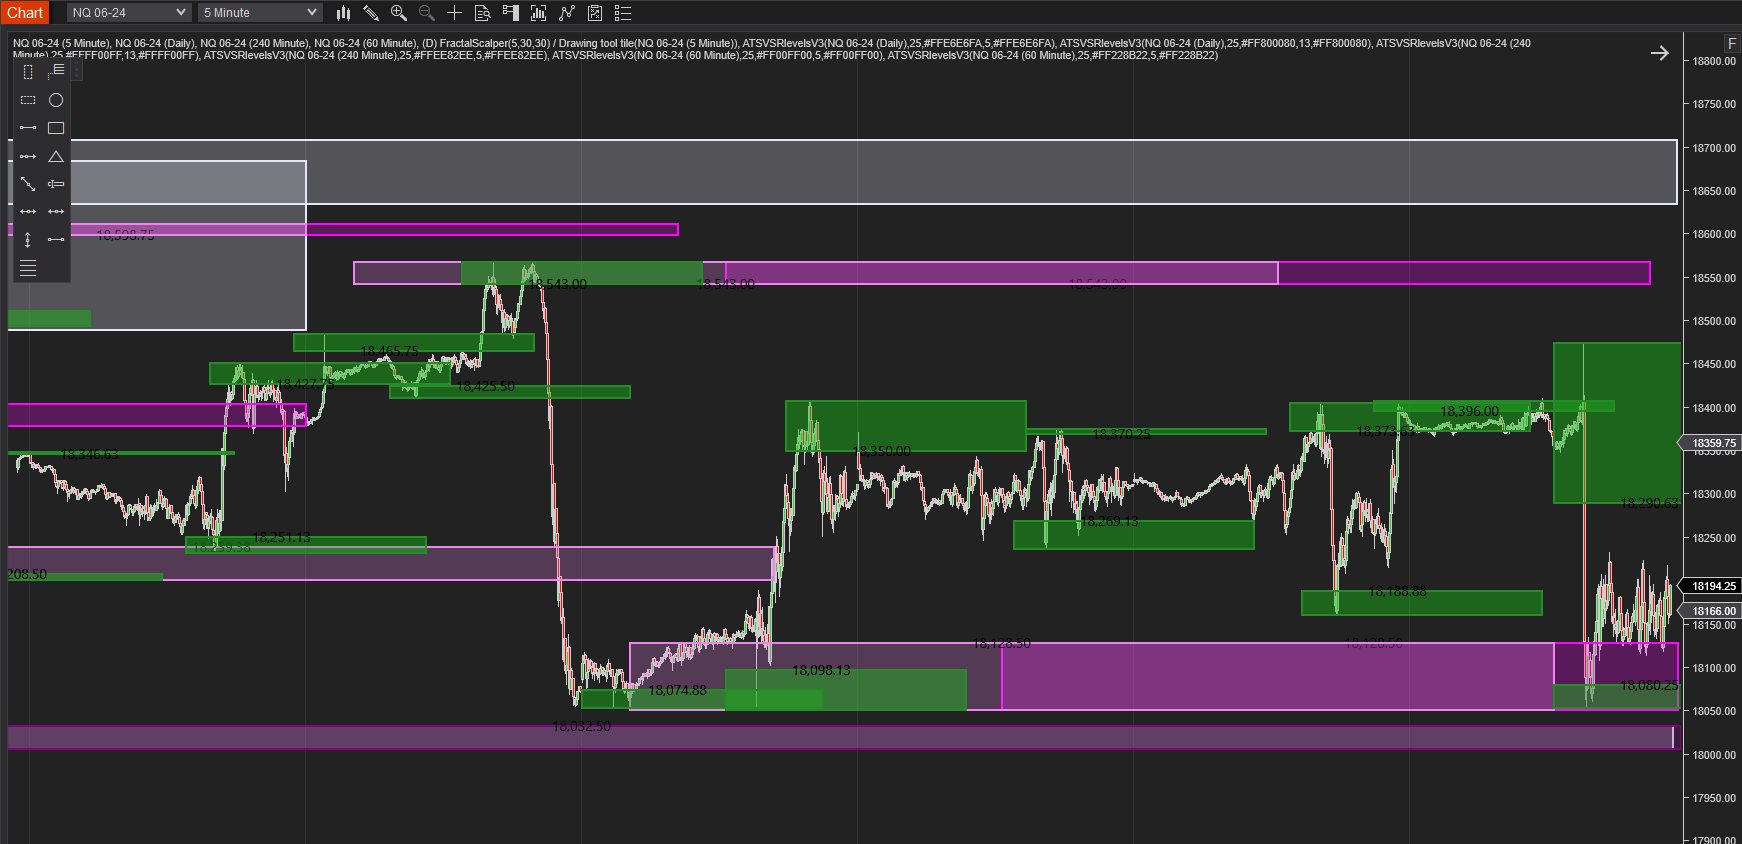
This indicator is designed to provide the trader with better trade locations by plotting visual support and resistance levels at swing points in the market. When multiple data series are used, the ATS VSR Levels can be plotted using the higher timeframe.
Scalper Pivot Point indicates reversals in real-time and on the FIRST TICK of the bar. If you understand the basics of how to read price action and are looking for an additional signal for entries and exits, then Scalper Pivot Point software is for you!
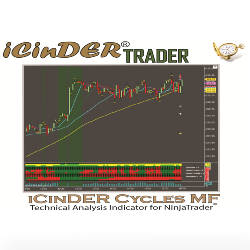
The iCinDER™ MF (Market Forces) includes all of the iCinDER™ family of indicators as part of a complete set. The analysis is based on internal market force of the instrument being analyzed. Learn more!
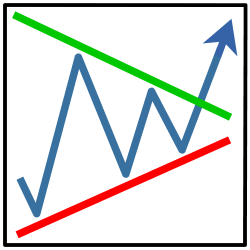
Take trendline trading to a new level with the TrendlineProTrader, developed with your favorite trendline tactics including: horizontal, diagonal, channel OCO, and breakout-pullback. It includes automated trade management and traders can use their own indicators. See TrendlineProTrader in action!
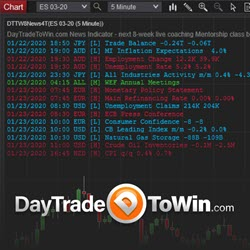
Download our FREE news indicator to see upcoming/scheduled financial news events plotted right on your chart. News events can cause sudden volatility and losing trades. Use this tool to stay informed. Watch the "Trading the News" video: https://daytradetowin.com/educational-trading-videos
The Helix strategy is the combination of our Entry Zone indicator and the Trade Management strategy, hence the name Helix (or double Helix). Helix allows you to create your Entry Zones based on your setup rules. Then, after trade execution, Helix will manage the trade based on your rules.
TTT Range Indicator plots the data from the TTT E-book directly on NinjaTrader Charts. Determine the range of an instrument prior to potential reversals, and the average once the high and low for the day is recorded. Learn more!
December 2, 2024
Mastering Sideways Markets With Auction Bars and Range Projections
November 19, 2024
Enhancing Your Automated Trading System: Key Insights from Best Pro Trade
November 14, 2024
NinjaTrader New Ecosystem Tools: October 2024 Edition
Enter Email for Updates