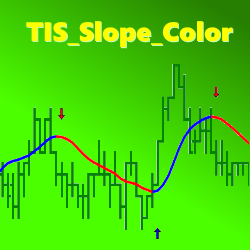
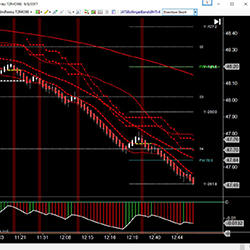
The TIS_Slope_Color indicator allows traders to detect the slope change of any line from any indicator. It can then paint the line, the background, or paint entry signals on a chart.
Get your trade information at-a-glance. Adding the Status Box on your chart allows you to see your relevant trade stats instantly.
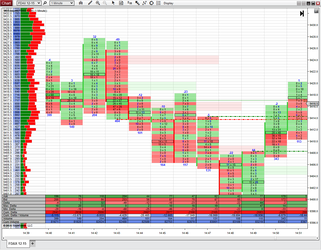
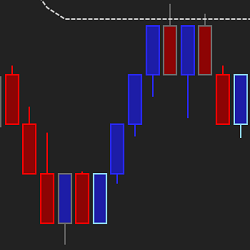
Pure and simple footprint (aka market profile or order flow chart) and volume profile chart add-on for NinjaTrader. Displays bid and ask volume traded at each price at each bar. Alternative charts – range, volume and tick charts - are also fully supported.
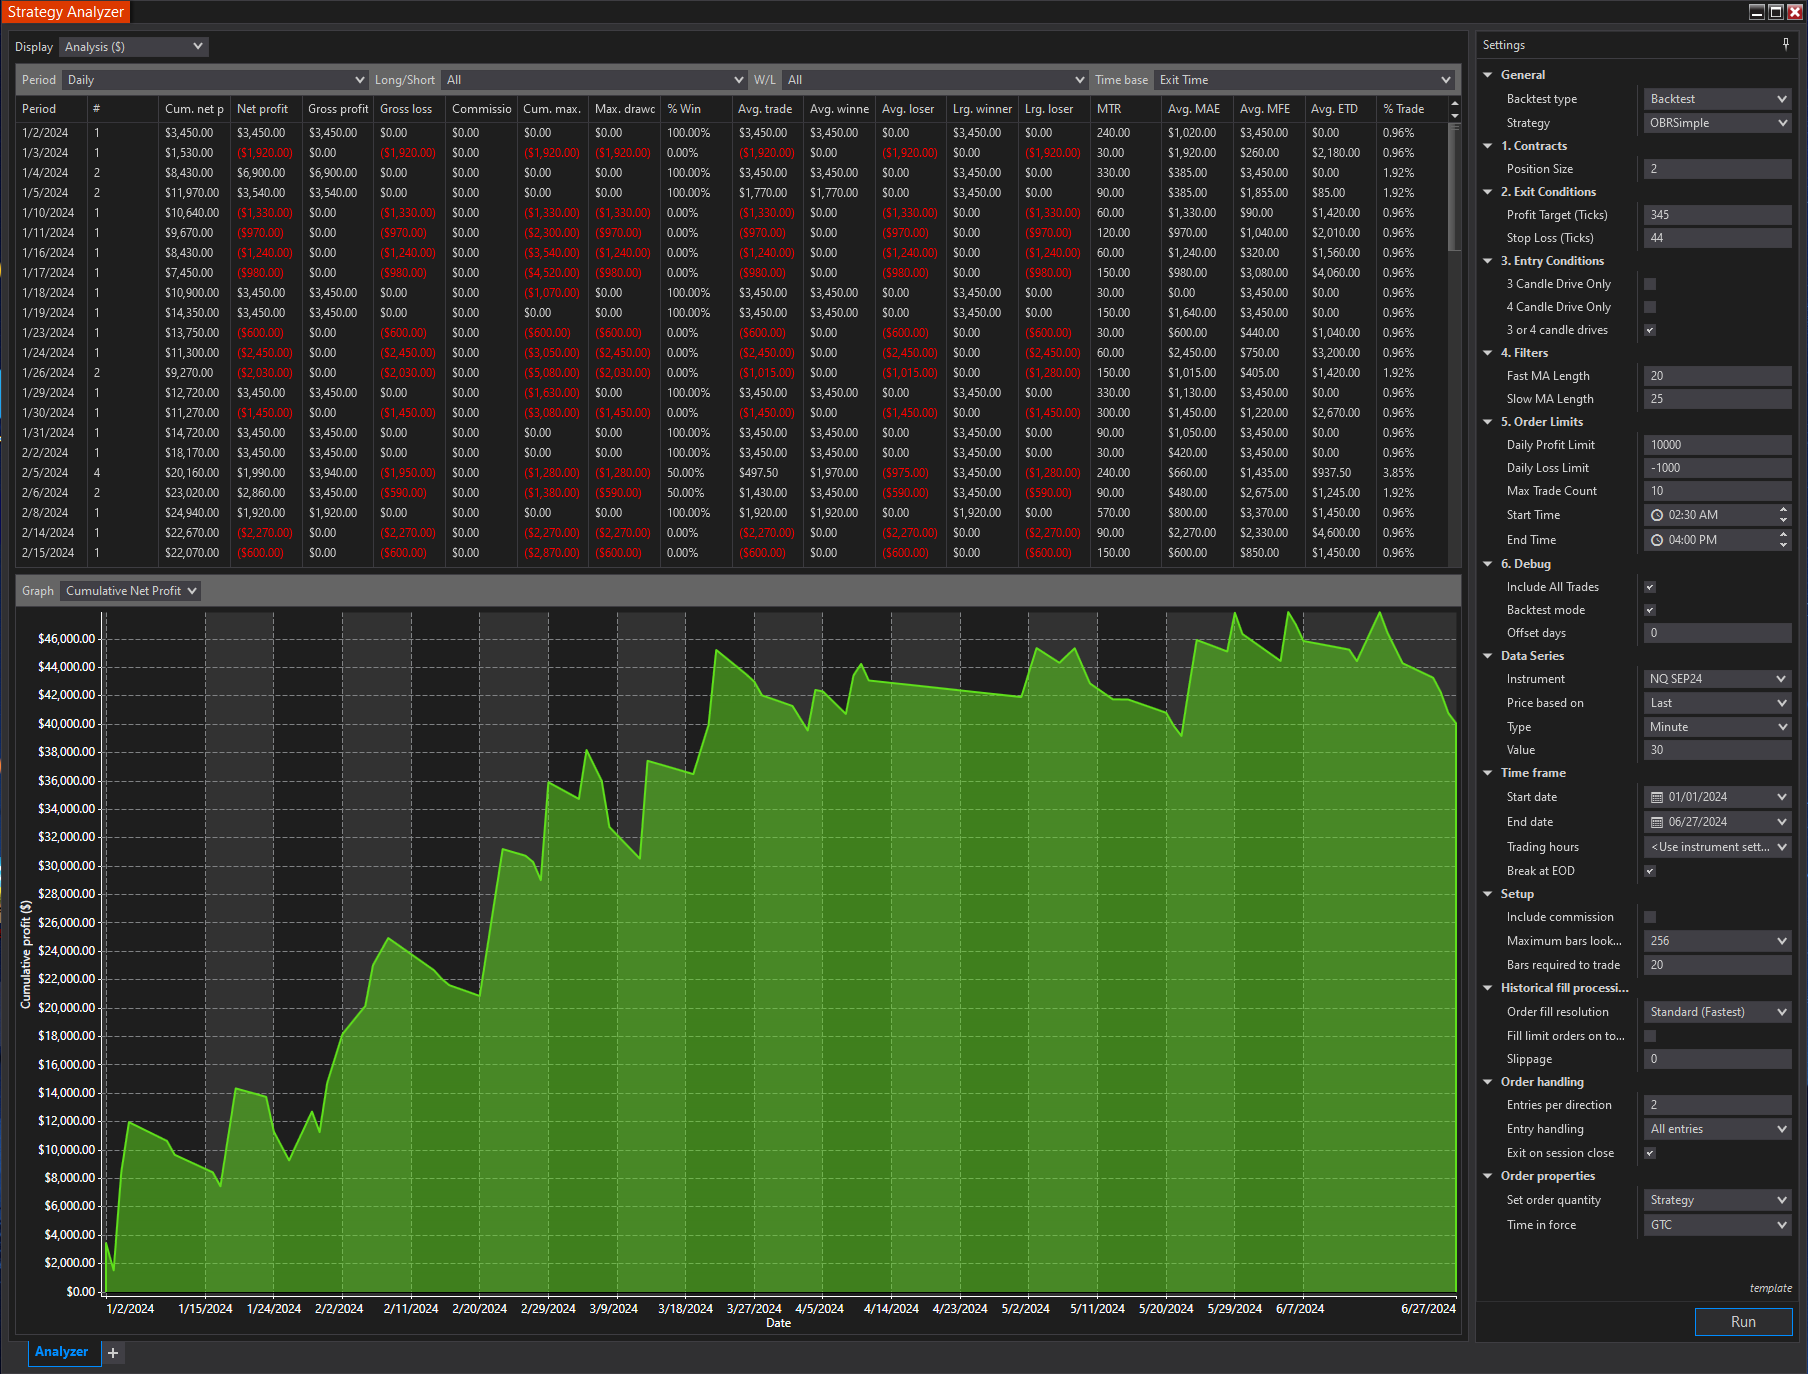
The Order Block Reversal strategy harnesses advanced market analysis techniques to identify and capitalize on bullish and bearish trends effectively. By integrating engulfing pattern detection and strategic entry points, this strategy offers clear signals for optimizing your trading decisions.
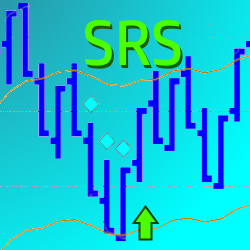
This indicator paints entry signals on pullbacks and allows the trader to avoid sideways market conditions. It includes a filter to only paint signals if there is also a Stochastics overbought/oversold condition. Click here to view examples and try today!
The JATS™ Complete Package* includes the JATSLRTLines™ Indicator for NT8 as well as a comprehensive set of Black Box Shark Indicators BloodHound Templates customized for NinjaTrader Charts and the Market Analyzer.
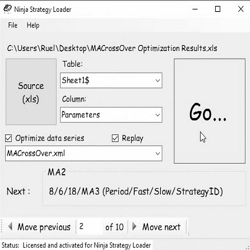
The Ninja Strategy loader allows traders to quickly and accurately load strategies into the NinjaTrader Strategy Tab or Chart Windows. Learn more!
Get precious info to start your trading week! Focused 100% in E-mini S&P500 Futures and based in a mix of technical analysis with order flow tools, the newsletter presents possible trading scenarios for the week, highlighting important regions. Sign up now for FREE!
Track volume profile in three timescales easily! Optimal Vision analyses point of control and value area breakouts in three rolling lookback periods of your choice and color-codes your bars by strength of signal. A simple way to bring dynamic volume profile to your trading! Strategy compatible.
Performs real-time analysis of the volume and price trends to color the lower panel of the chart with actionable information. When both are trending in the opposite direction, the panel will be colored purple to mark this "unusual behavior." Start using this key Information in your trade plan today!
December 2, 2024
Mastering Sideways Markets With Auction Bars and Range Projections
November 19, 2024
Enhancing Your Automated Trading System: Key Insights from Best Pro Trade
November 14, 2024
NinjaTrader New Ecosystem Tools: October 2024 Edition
Enter Email for Updates