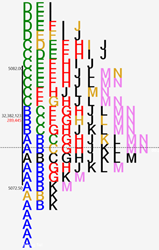
Elevate your market analysis with advanced features. This tool offers automatic reference lines, alternate volume figures and various displays like TPO profiles and volume at price. It integrates Jim Dalton studies and provides detailed reports on weak references and volume distribution.
The platform is responsible for finding multiple patterns in operations and provides statistics which help traders in the decision-making process. Try it now free!
ThunderZilla is a user-friendly trading system designed to enhance your pullback trading. It integrates essential features for a well-rounded approach, including trend identification, entry signals, stop placements, targets, and trailing stops.
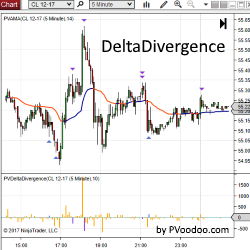
PVDeltaDivergence Indicator is a powerful tool designed to help traders identify possible turning points in their favorite markets with order flow analysis. Get a free trial of PVDeltaDivergence for NinjaTrader today!
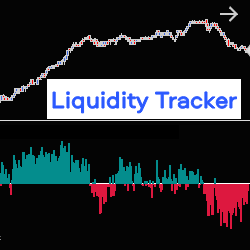
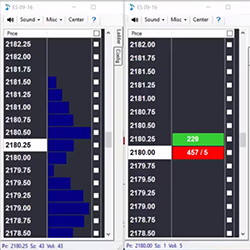
The Liquidity Tracker allows you to monitor, in real time, liquidity variations in the Order Book (pending orders at Bid & Ask), on one or two correlated instruments, at the same time. It therefore allows you to follow the evolution of the market based on the strength of supply or demand.
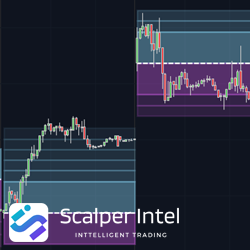
Elevate your trading strategy with the Day Range Zones Indicator for NinjaTrader 8. Calculate potential daily trading ranges from the opening price using historical data and standard deviations. Identify key support and resistance areas, manage risks, and anticipate price movements.
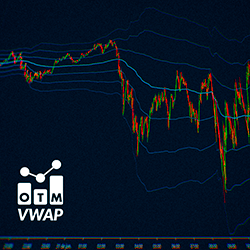
OTM VWAP, the "Volume Weighted Average Price," acts as a moving average based on trading volume. It includes the central VWAP, which serves as support or resistance depending on the price position and its deviations. With this indicator you can set VWAP per session, weekly and monthly.
Customized private mentoring sessions with full time trader & Easy E-mini Trade owner, Trisha Ogilvie. Contact Trisha today for additional information and availability.
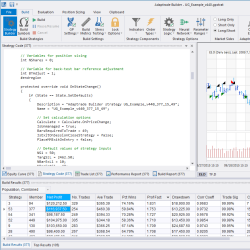
Developing automated trading strategies can be time consuming and difficult. Adaptrade Builder is an advanced trading strategy generator that will quickly find, code and test unique and complete trading strategies based on your requirements. Start building strategies today with a free 30-day trial!
PriceSquawk empowers traders with an audible market perspective of order flow and price action across asset classes, giving traders the focus needed to respond to leading market information. Monitor markets via the customizable squawk feed, T&S trade sounds and order flow alerts.
December 2, 2024
Mastering Sideways Markets With Auction Bars and Range Projections
November 19, 2024
Enhancing Your Automated Trading System: Key Insights from Best Pro Trade
November 14, 2024
NinjaTrader New Ecosystem Tools: October 2024 Edition
Enter Email for Updates