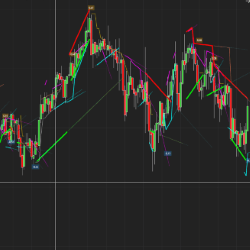
Trendlines can be drawn in so many incorrect ways. Drawing it incorrectly can make most trades losers and vice versa. Getting it right makes all the difference! QTL has a faster and far more accurate approach. Ready to automatically find the most accurate trendlines?
Strong momentum cannot be maintained! Traders will always exit their position at a certain level, which causes price to pullback or retrace. Measuring strong momentum can help the trader to anticipate the eventual exhaustion. An award winning "heads-up display" indicator from The Intentional Trader!
Actual Trading are professional traders and experts in market analysis, providing personalized training adapted to the needs of the customer. NinjaScript programming and development on demand. Exclusive indicators and systems for retail, professional, or institutional trading, and much more.
TS Trades is live market commentary, focused on identifying trade setups that are forming in real-time based on input from TS TradePlan. Get started with a 2-week trial for your favorite markets.
Get information about the development of a dynamic and descretionary trading model. This is intended to inform people of a coaching program tailored to their specific needs in order to make them more consistent traders.
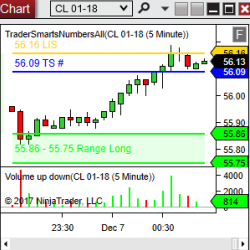
LogikVolumeWand is a dynamic volume / tick / price distribution analysis tool that displays information computed within a user drawn rectangle, combining the usefulness of Volume Point of Control, Volume Delta, and Volume Footprint analysis into one tool. See more in the video demonstration!
Weekly one-on-one coaching tailors trader development to the individual. Evening Chartbook & Market Recap, Daily Briefing and Sunday Evening Review reinforce technical and fundamental development and guide the practical application of tools, methods and strategy maturing into Best Practices.
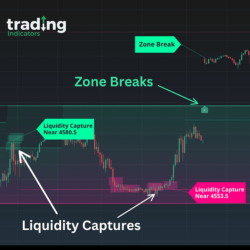
With Liquidity IQ, you have a personal "Technical Analysis" trading assistant by your side, dedicated to highlighting critical trading levels and trends. And the best part? It works continuously, updating in real-time as the market changes.
Visit our website, leave your e-mail address and get our document for free!
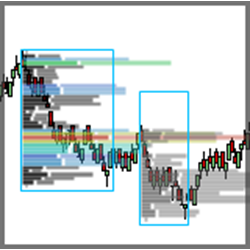
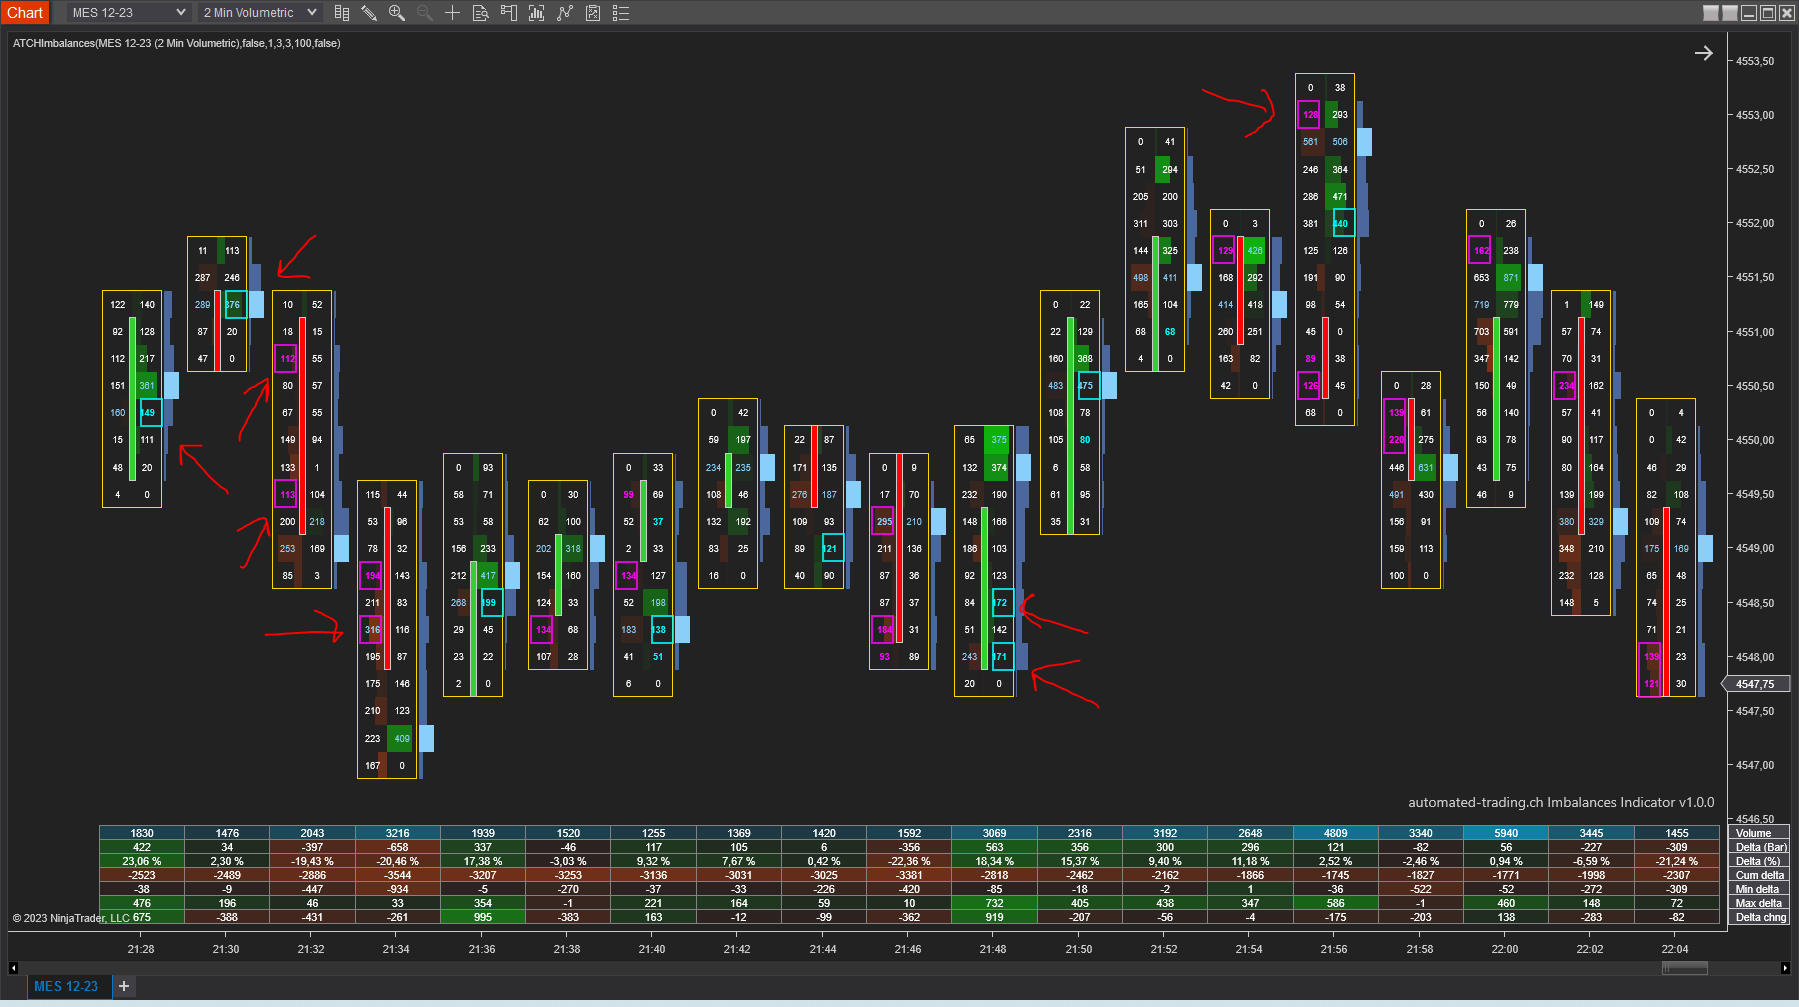
Volume imbalances is a free NinjaTrader 8 indicator that highlights diagonal volume imbalances on both footprint charts and regular candlestick charts. Imbalances occurs on price levels where trade volume on one side (bid/ask) is excess over the trade volume on the opposite side.
December 2, 2024
Mastering Sideways Markets With Auction Bars and Range Projections
November 19, 2024
Enhancing Your Automated Trading System: Key Insights from Best Pro Trade
November 14, 2024
NinjaTrader New Ecosystem Tools: October 2024 Edition
Enter Email for Updates