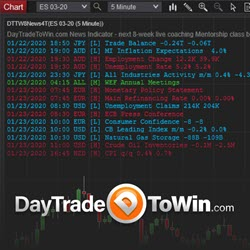
Download our FREE news indicator to see upcoming/scheduled financial news events plotted right on your chart. News events can cause sudden volatility and losing trades. Use this tool to stay informed. Watch the "Trading the News" video: https://daytradetowin.com/educational-trading-videos
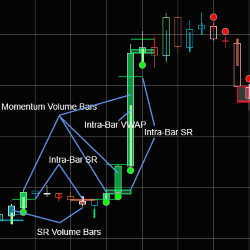
Every bar contains information. You miss a lot of valuable information due to filtering bars by time, variance or some other method. The best solution is to allow these bars to provide you with all the valuable and needed information in a compact and informative manner.
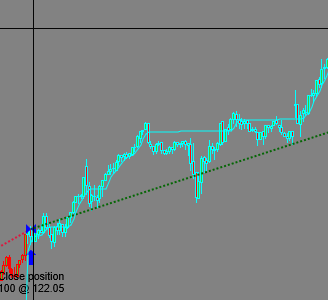
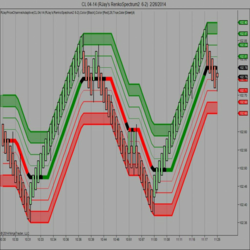
A trend following tool that can achieve exceptionally high risk/reward ratios when applied to suitable markets that trend well. Locks onto trends and does not let go until the trend ends. Not entirely suitable for novices. Strategy, paint bar and indicator included. Automated or manual operation.
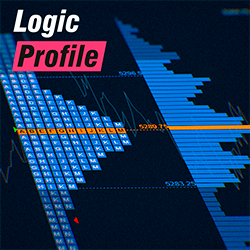
Includes volume profile and TPO market profile, presets for one-click charting, daily, weekly, monthly, date, composite, and drawn profiles. Offers defined or continuous session types and load optimization. All of these features make it one of the most advanced profiles available on the market.
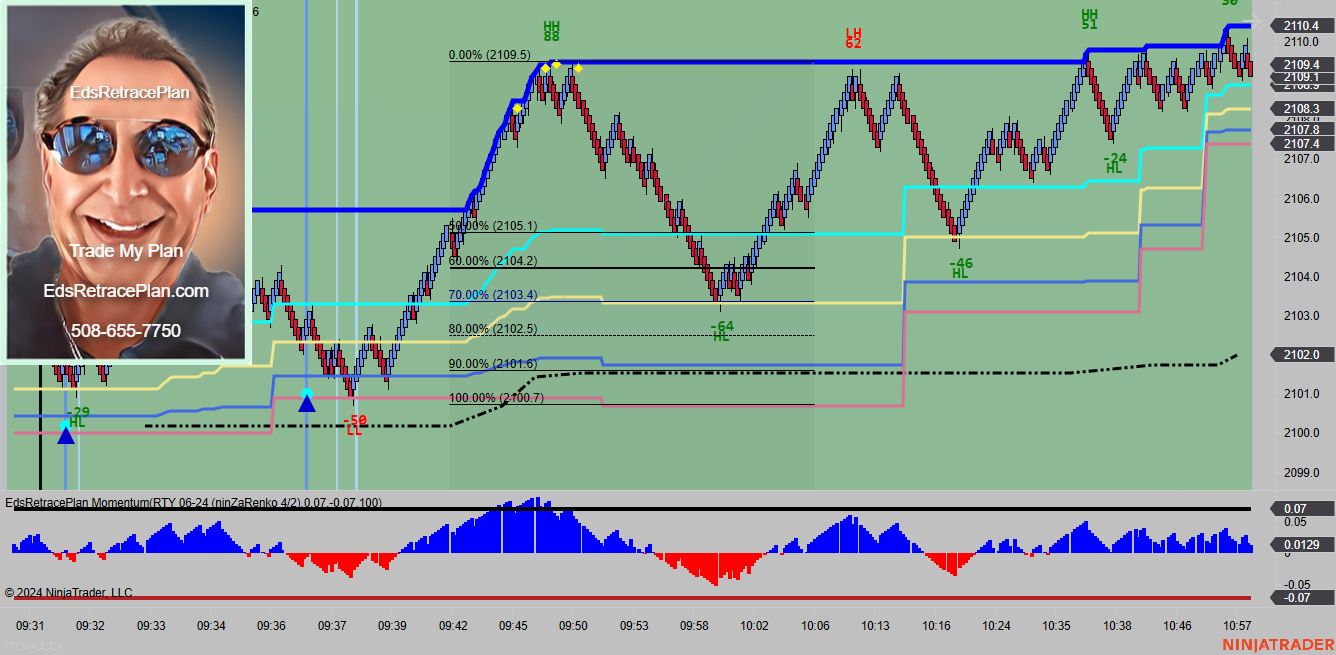
EdsRetracePlan Momentum Reversal Indicator is for day trading ES, YM, RTY, NQ, CL and GC. The indicator identifies reversal trades by finding and marking tops and bottoms. These trades signal the end of a move and opportunities to get short at the highs and long at the lows.
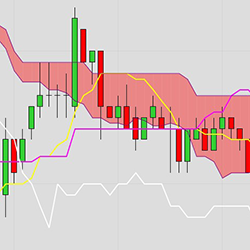
Free Ichimoku Cloud Indicator for NinjaTrader 8! This indicator can be used for both discretionary trading or as part of a NinjaScript based strategy. Download it today!
Improve Your Trade is a fully-automated trading journal which records and tracks every trade you make automatically. It even adds screenshots of your trades, allowing you to focus on the important things like analyzing your trading performance!
Choose from an assortment of indicators with enhancements not found anywhere else. (Digital Clock, Bar Timer, Divergence, Price Channel, Current Bar Range). Get free trials of these unique indicators now!
Collect MAE/MFE data where NinjaTrader leaves off. Get the ability to measure your moves after you're out of the trade.
This incredibly innovative suite of Bollinger Bands and divergence indicators shows selected, plotted ‘dots’ with a broad selection of Bollinger Band combinations. You can choose from seven indicator combinations!
December 2, 2024
Mastering Sideways Markets With Auction Bars and Range Projections
November 19, 2024
Enhancing Your Automated Trading System: Key Insights from Best Pro Trade
November 14, 2024
NinjaTrader New Ecosystem Tools: October 2024 Edition
Enter Email for Updates