QuantVPS provides ultra fast, reliable, and secure virtual private servers optimized for algorithmic trading. With instant setup and 24/7 support, their servers ensure your trading systems run efficiently, reducing latency and ensuring uptime. Optimize your execution with QuantVPS.com.
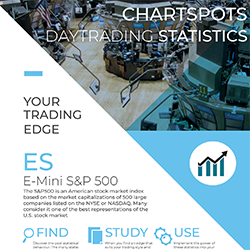
Use Statistics to determine intraday High Probability Targets and place stops outside of the regular market noise. This includes Stats on Initial Balance, Mid, Session & Extension ranges, as well as 1-minute rotations & many more! Available for ES, NQ, FDAX & FESX. Download your free report now!
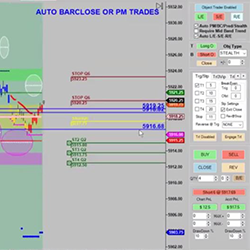
PriceActionPivoter is a fully automated trading system that uses price action and pivot points to execute trades. Primarily designed for ES/MES, but you can trade anything on it. This trading system also offers money management settings so you can have full control over every aspect of your trading.
The Viper Pro Ultimate Trading Room is open for the first two hours of each trading day - Monday through Friday. Each morning, literally hundreds of traders from all over the US and throughout the world actively participate in these live market trading sessions. Live trade calls are made on as many as nine futures instruments.
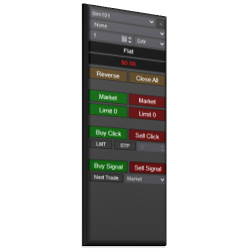
The Signal Entry Orders indicator allows traders to click a button that initiates logic to submit orders immediately on the close of a bar, as soon as a signal occurs. This removes unnecessary stress and challenge when entering orders.
NinjaCoding TPO & VolumeProfile is a multifunctional tool that plots TPO and VolumeProfiles on NinjaTrader charts. Users are presented with single or double views, value area calculations, point of control, color coding, initial balance and much more. Please explore the website for more!
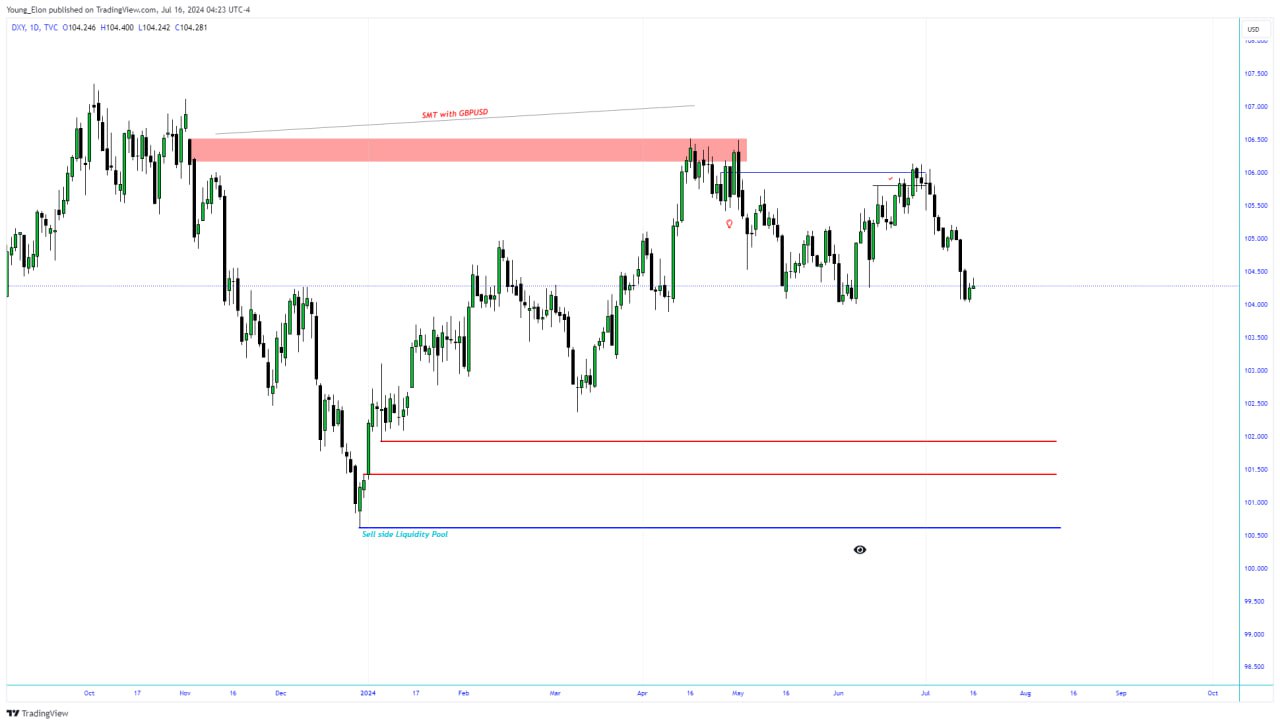
This is a YouTube channel, in which they share the precise models for smart money trading concepts. With the concepts, you can trade like the banks, by following their foot prints. With the models, you are able to see the specific footprints and in return trade like the institutions.
This model balances four separate risk lenses that seek to generate alpha while moderating standard deviation over multi-year periods. Each risk lens is independently applied based on Alpha Vee's breakthrough fundamental momentum research. Equities are from small/mid cap universes.
Trade smarter with multiple candlestick patterns. This indicator uses pattern recognition to scan for 16 different candlestick patterns. It detects bullish, bearish and gap patterns. It can be used with Bloodhound and NinjaTrader's Market Analyzer.
Learn how to analyze the financial markets in this online trading course! The core methodology is based on supply and demand and institutional order flow principles. Unlimited access to multiple training formats are available including fun interactive quiz's. Enroll today!
December 2, 2024
Mastering Sideways Markets With Auction Bars and Range Projections
November 19, 2024
Enhancing Your Automated Trading System: Key Insights from Best Pro Trade
November 14, 2024
NinjaTrader New Ecosystem Tools: October 2024 Edition
Enter Email for Updates