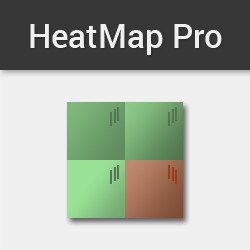
Simplify trading screens, and be the first to spot the trend. HeatMap is a tool that informs you when futures, forex or equities markets are all correlated in the same direction, or mixed. Know at a glance when follow through is high, or when the markets are sideways. Get the HeatMap now!
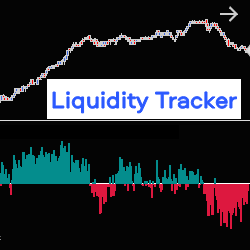
The Liquidity Tracker allows you to monitor, in real time, liquidity variations in the Order Book (pending orders at Bid & Ask), on one or two correlated instruments, at the same time. It therefore allows you to follow the evolution of the market based on the strength of supply or demand.
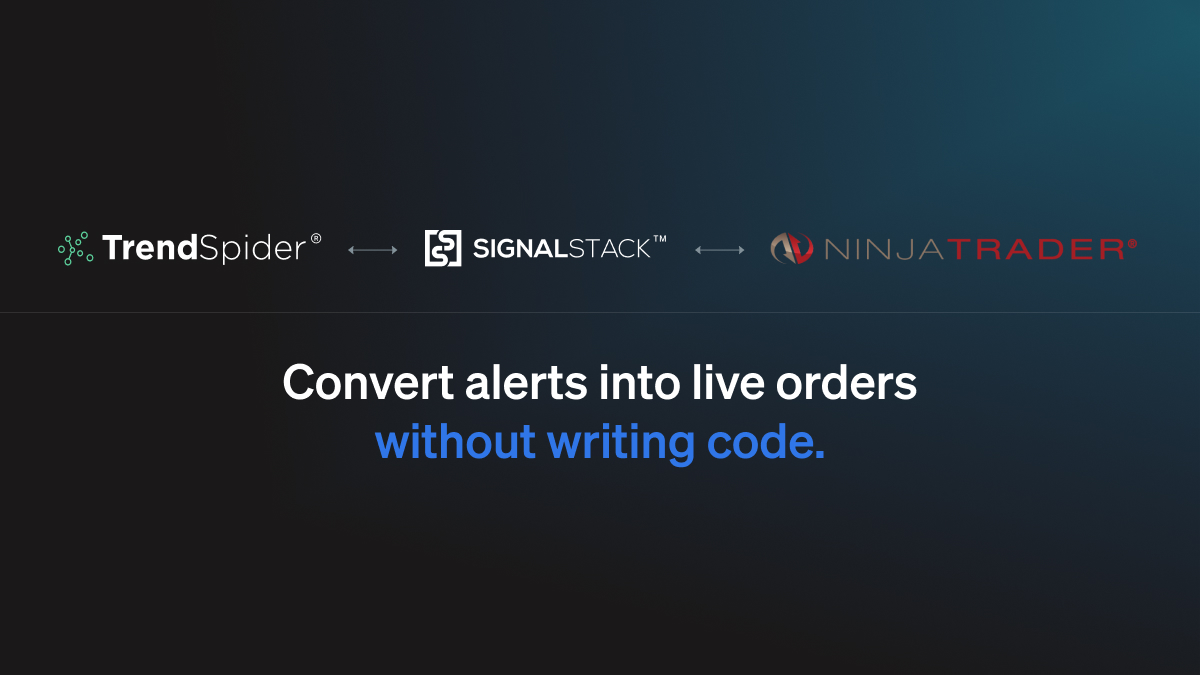
SignalStack is a fast, easy and simple way to convert any alert from any trading platform into an executed order in any brokerage account – automatically and without writing any code.
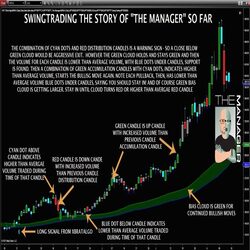
The Manager helps with simple and repeatable trade management. Using a number of tools like average volume, volume distribution or accumulation and an adjustable BIAS cloud, it can help you evaluate whether the market is reversing or just pulling back.
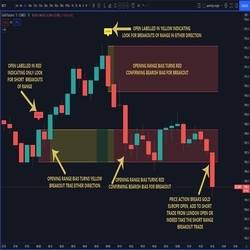
Defines the opening ranges of major markets, gold and oil pit opens, and major data points. The range has a cloud which automatically changes color depending on the market bias and continues until the open the next day. This allows for multiple entries of breakouts throughout the following 24 hours.
Trading coach with volume and price indicators.
A fantastic way of using the Quotes Delta setting on Bookmap.com to identify whether important support and liquidity levels will hold or break, the Sweep Show setup has helped Nic understand when it was time to fade a move or go with it in E-mini S&P 500 futures.
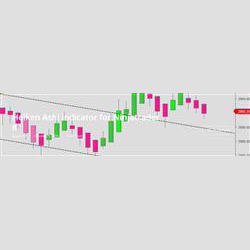
Much more than just a great looking set of Heiken Ashi bars! Integrated supply and demand levels, voice alerts, picture-in-picture mode, bar speed monitoring as well as volume and trend analysis. Super clean and fast with lots of options. API for the zones and algo bias. Free trial available.
What a lovely day yesterday was! Do you ever wonder if there were similar days in the history of a trading instrument, and what happened thereafter? With the Similar Days Project, view price scenarios for 24 different currency pairs. This technology is scalable on any market.
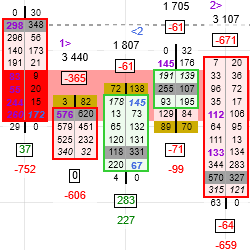
GomOrderflowPro displays the following data: sells, buys, delta & the associated calculations. It computes buy/sell imbalances & builds the associated support and resistance zones. The plots are available for building strategies or populating the Market Analyzer window. Free 2-week trial available.
December 2, 2024
Mastering Sideways Markets With Auction Bars and Range Projections
November 19, 2024
Enhancing Your Automated Trading System: Key Insights from Best Pro Trade
November 14, 2024
NinjaTrader New Ecosystem Tools: October 2024 Edition
Enter Email for Updates