Volume Profile is a very well-known and very much-used indicator in trading, but with a twist! Our indicator will give you the ability to automatically anchor it to various starting points and, better yet, use it in your automated strategies and backtesting.
With a potential of 1 trade per day, this system is automated from start to finish & designed to be monitored in some capacity. If you can remotely access a computer with the right software, then you can monitor these automated trades from the golf course (with a strong cell signal).
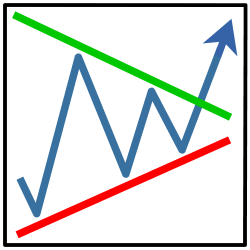
Take trendline trading to a new level with the TrendlineProTrader, developed with your favorite trendline tactics including: horizontal, diagonal, channel OCO, and breakout-pullback. It includes automated trade management and traders can use their own indicators. See TrendlineProTrader in action!
This incredibly innovative suite of Bollinger Bands and divergence indicators shows selected, plotted ‘dots’ with a broad selection of Bollinger Band combinations. You can choose from seven indicator combinations!
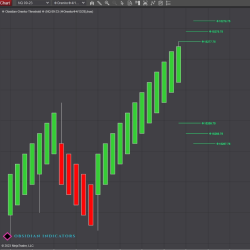
Orenko bars focus on price movements, filtering out market noise and providing a clear representation of trends and reversals, making it easier for traders to identify trading opportunities. Orenko Threshold highlights the potential formation of the next three bars trend and reversal threshold.
If you've never considered support and resistance from the perspective of volume – think again. Light volume regions indicate price action passing through and a great signal for continuation of trend. High volume suggests a pause point. Just what you need to know in advance. So, grab yours now!
Scalper Ticket was made to facilitate and improve the performance of scalping operations by gaining speed in quantity changes at the bid/ask levels. It shows the first book line, position average price and the PnL with commissions cost. A perfect match to use in conjunction with the SuperDOM.
The Roller Coaster is a Stochastic/MACD cross indicator with special EMA Points of Control for both long and short trades. Our algorithm works everything out behind the scenes, keeping your chart clean.
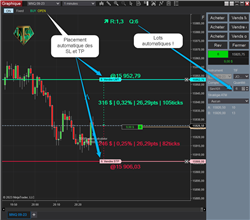
This indicator will automatically calculate for you the quantity of lots according to the position of StopLoss and the risk as a percentage of your capital. It will also place your StopLoss and TakeProfit. Finally get constant risk by trading on Futures contracts!
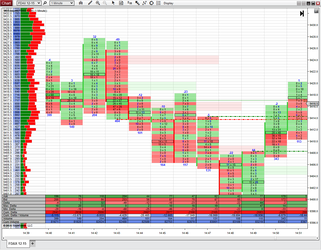
Pure and simple footprint (aka market profile or order flow chart) and volume profile chart add-on for NinjaTrader. Displays bid and ask volume traded at each price at each bar. Alternative charts – range, volume and tick charts - are also fully supported.
December 2, 2024
Mastering Sideways Markets With Auction Bars and Range Projections
November 19, 2024
Enhancing Your Automated Trading System: Key Insights from Best Pro Trade
November 14, 2024
NinjaTrader New Ecosystem Tools: October 2024 Edition
Enter Email for Updates