This ultimate package provides high-quality, reliable signals with quick, easy, and precise order entry. Agile Piranha Scalping generates rapid, high-frequency signals, swiftly executed within a small market range. It elevate your scalping with efficiency and reliability.
We offer programming services for users of NinjaTrader. Our expert IT professionals will be glad to work on your most ambitious projects. We specialize in programming strategies based on Order Flow, Market Profile and VWAP to automate trading as a mechanical system.
Chicagostock Trading’s Pro membership includes a live trading room with real-time charts to view trading signals on ES and CL Futures. Members also receive a daily technical analysis report by email before market open with proprietary volatility windows and pivots. Ask about a 2-week trial today!
Standard NinjaTrader functionality requires at least eight clicks to "Attach to Indicator". With Quick Trade Ninja, you can automatically move your orders based on any indicator you choose - all with a single click. Auto-trailing stop-loss.
MTM can trade multiple accounts, instruments (baskets) and orders (grids) simultaneously in one trade. Submit "stealthy" orders. Flexible stop-loss and profit targets. MTM Trendicator for Forex/crypto strength. Time-based trade exits. Monitor news. Save trade profiles for re-use. And much more!
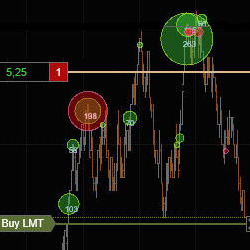
Would you like to see traders' emotions visualized right on a chart? Identify developing intraday reversals in real time, detect where retail traders place their stops and trade against them. Check historical data for solid setups. Get started with your 7-day free trial today!
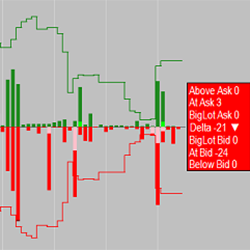
Use the Tape? Time & Sales can be hard to follow; however, this indicator boils it down to an easy to read histogram. Easily see the bid & ask trades, above ask & below bid trades, BigLot trades, the delta bid/ask ratio and much more. Learn more about the BigLotHistogram indicator now!
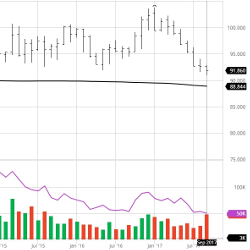
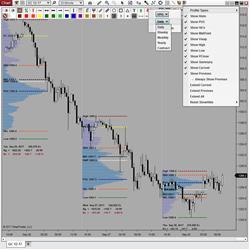
Volume Profile Sessions features 5 Profile Durations (Daily, Weekly, Monthly, Yearly, Contract) and 3 Modes of Calculation (bar/min/tick). It displays 8 Levels of Significance (VPOC, VA's, VWAP, High/Low/Mid, PClose) & session summaries, and provides simple configuration thru a toolbar icon!
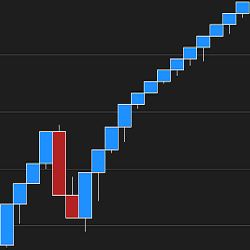
Say goodbye to fixed brick sizes! Optimal Renko Bars' advanced logic auto-selects the smoothest-fit Renko bars for your chart in real time! Dynamic, self-adjusting bar type that responds to today's market.
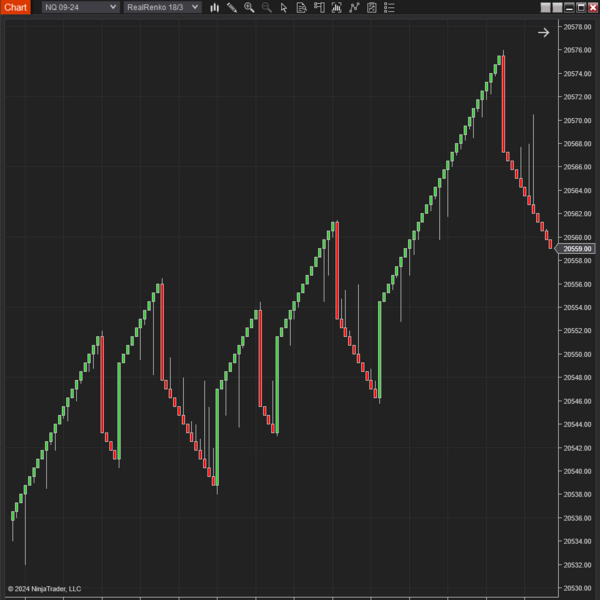
Enhance your trading strategy with RealRenko Bars! Designed for precision and flexibility, these bars allow you to set a custom brick size and trend threshold, providing a clearer picture of market movements.
December 2, 2024
Mastering Sideways Markets With Auction Bars and Range Projections
November 19, 2024
Enhancing Your Automated Trading System: Key Insights from Best Pro Trade
November 14, 2024
NinjaTrader New Ecosystem Tools: October 2024 Edition
Enter Email for Updates