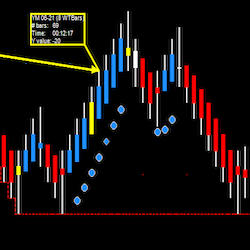
Day trading E-Mini futures system focused on trading the RTY, NQ, YM, ES and FDAX futures. Combines a proprietary chart, indicators and trade plans, along with a live training room every market session. Completed in thirty minutes or less on most days.
BitBlockBridge for Bybit Traders is a NinjaTrader add-on offering real-time cryptocurrency chart data, supporting both minute and tick charts. Designed for Bybit traders, it integrates seamlessly with NinjaTrader, providing comprehensive asset coverage, a user-friendly interface, and more.
ICT's Fair Value Gap indicator retains a configurable number of gaps, and there's a setting to remove those that have been crossed by price. The style of the rectangle and the rays from the gaps are customizable by creating a template for a rectangle named "FVG Up Gap" (for the Up gaps).
The Viper Indicators include long and short trade entry signals as well as a trend indicator which can be used as a trade re-entry trigger and trailing stop. After many years of development and rigorous testing in a live trading environment, this system has proved itself with traders all around the world.
These two indicators together will display powerful momentum trading setups by defining the critical levels and pivots. The advantage of this with the market is recognized when repeatable scenarios and situations arise despite the fact that the market never shapes up exactly the same way twice.
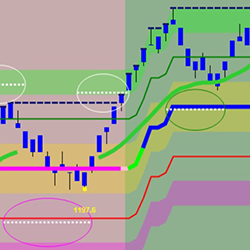
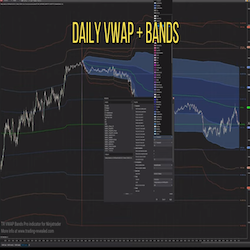
The VWAP Bands Pro indicator for NinjaTrader 8 is a must-have for traders who want to see the market map in real time along with precise support/resistance levels used by the big firms algorithm.
Daily Levels plots important levels such as prior days open/high/low/mid/close, overnight high/low/mid, IB high/low and more! It also displays historical probabilities of price touching each level in regular and overnight sessions for the most popular futures products.
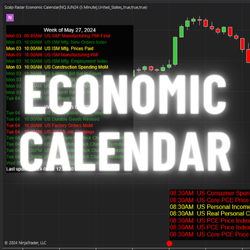
Stay ahead of market-moving events with this comprehensive news agenda, displaying upcoming events like CPI, PPI and Jobs data categorized by impact. Event marker are drawn directly on your chart with hover-over features. Filter by country, impact, or event name to optimize your trading strategy.
The Arnaud Legoux Moving Average (ALMA) is a powerful technical indicator designed to improve the accuracy of moving average calculations. ALMA indicator is an advanced variation of traditional moving averages that aims to reduce lag and noise while providing better responsiveness to market changes.
This course is aimed at all who wish to understand the American financial market and participate in it, either by actively trading or long-term investing. We cover topics such as opening an account abroad, IR, news and advanced techniques to operate assets such as S&P500 and Petroleum.
December 2, 2024
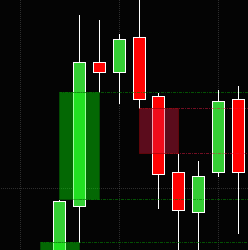
Mastering Sideways Markets With Auction Bars and Range Projections
November 19, 2024
Enhancing Your Automated Trading System: Key Insights from Best Pro Trade
November 14, 2024
NinjaTrader New Ecosystem Tools: October 2024 Edition
Enter Email for Updates