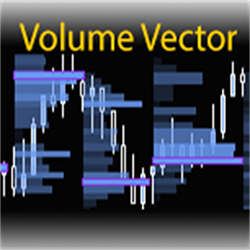
The Volume Vector tool creates automatic volume profiling of price action swings. Increase trading consistency and see exactly where trades have been initiated!
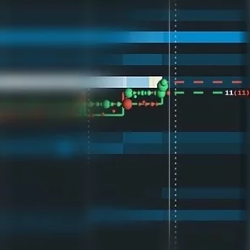
A fantastic way of using the Quotes Delta setting on Bookmap.com to identify whether important support and liquidity levels will hold or break, the Sweep Show setup has helped Nic understand when it was time to fade a move or go with it in E-mini S&P 500 futures.
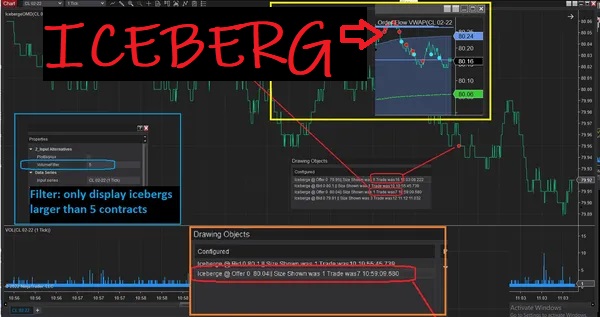
Detect sophisticated large traders, attempting to obfuscate their trading by only posting or displaying a portion of their order size. Indicator will highlight prices on a chart where iceberg was used and for how many contracts.
The STMA indicator offers traders the ability to auto plot higher timeframe Simple or Exponential Moving Average’s on smaller time framed charts. Learn More about the STMA!
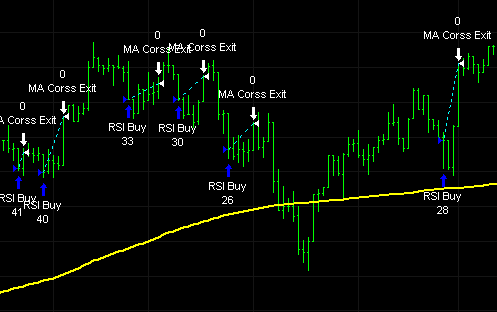
The Connors RSI2 strategy is a popular and well-known trading strategy developed by Larry Connors. It is designed to identify short-term overbought or oversold conditions in a market and exploit potential mean-reversion opportunities.
Choose from an assortment of indicators with enhancements not found anywhere else. (Digital Clock, Bar Timer, Divergence, Price Channel, Current Bar Range). Get free trials of these unique indicators now!
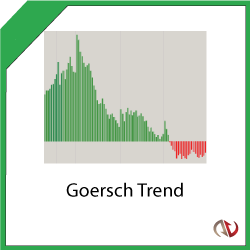
Confirm trend direction with this unique & proprietary indicator. It can be combined with any trading strategy to provide extra confirmation & is ideal for validating your open trades. It works out-of-the-box with no parametrization needed & detects Up and Down trends.
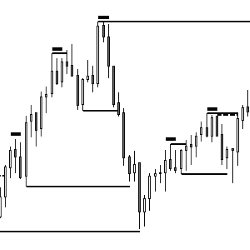
This indicator shows Double Bottoms and Double Tops which are tested by subsequent price action. It shows micro Double Bottoms & micro Double Tops as well. Use it as a discretionary indicator and for automated trading (e.g. BloodHound). Get started with a free 20-day trial today!
Get the latest knowledge for independent traders to help them create custom tools, and processes and develop the mind needed for a successful trading career. Learn a unique technical analysis method and build trading strategies with a known edge, using a computer-based statistical approach.
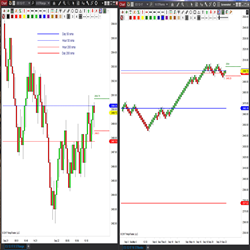
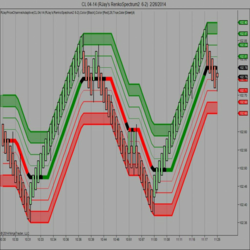
The system features two parallel cloud bands that enhance trend analysis. It provides two types of pullback signals: Fibonacci and price action, to expand trading opportunities. Additionally, the trailing stop plot, driven by price action, ensures timely exits during sudden market fluctuations.
December 2, 2024
Mastering Sideways Markets With Auction Bars and Range Projections
November 19, 2024
Enhancing Your Automated Trading System: Key Insights from Best Pro Trade
November 14, 2024
NinjaTrader New Ecosystem Tools: October 2024 Edition
Enter Email for Updates