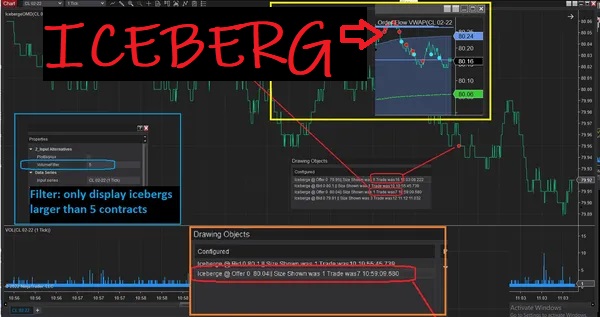
Detect sophisticated large traders, attempting to obfuscate their trading by only posting or displaying a portion of their order size. Indicator will highlight prices on a chart where iceberg was used and for how many contracts.
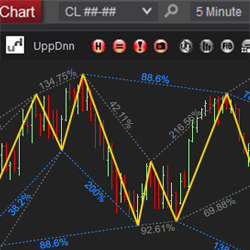
A traditional Gann Fan with 5 next-gen features to give your Gann analysis a new edge. This multi-timeframe Gann fan is what WD Gann himself would have created if he existed in today's fast paced digital landscape. A must to find support and resistance, real-time price momentum & geo signatures.
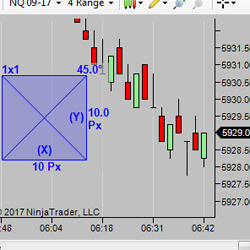
This tool is a valuable visual aid for traders who use Gann, Fibonacci, Point and Figure charts and want to see true angles. Simply load it on the chart and push the toolbar button when you want to use it, then adjust an axis until the chart is square. Using the 'Keep Centered' option will then keep price in the chart area while the chart is squared.
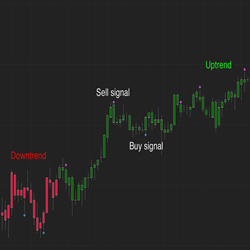
The Swing Toolkit is a collection of swing analysis tools designed to make trading faster and more consistent. Swing Pattern Trading utilizes the recognition of specific price patterns and the alignment of exact Fibonacci ratios to determine possible reversal points in the financial markets.
TradersPost simplifies automated trading across various asset classes. Automate your trades with ease, leveraging powerful tools and strategies designed for traders of all levels.
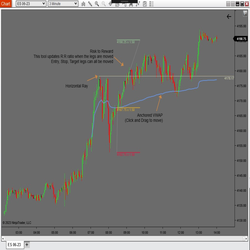
PureAlgo has developed a set of drawing tools to assist you with trading, including Anchored VWAP, Risk Reward PA and Horizontal Line. The package includes all of the tools and is priced at $10.
Stay in your trades for longer using our HeatMap indicator. One of the toughest problems can be getting into a trend or staying in a trend until the end. HeatMap looks at 4 factors which determine a trend and displays the results in an easy-to-read heatmap right on your charts.
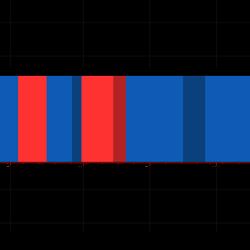
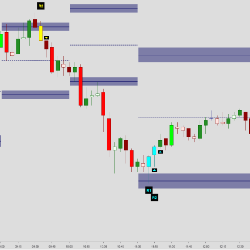
The Auction Bars indicator identifies higher time-frame ranges, displayed as Auction Ranges. These ranges show the current market value area of the ongoing auction. The accompanying congestion zones work as support / resistance where spike and reversal patterns frequently plot.
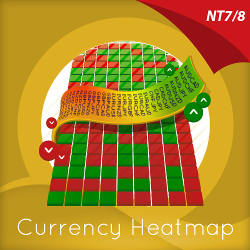
The Currency Heatmap displays the “hottest” and “coldest” areas of the forex landscape. Vertically, 28 currency pairs are listed and ranked from the most bullish to the most bearish. Horizontally, each cell then displays bullish and bearish sentiment across multiple timeframes instantly.
Q-ProTrader is a fully integrated day trading automated strategy which trades the E-mini futures contract. This package includes both the Q-ProTraderIndicator and Q-ProTraderStrategy.
December 2, 2024
Mastering Sideways Markets With Auction Bars and Range Projections
November 19, 2024
Enhancing Your Automated Trading System: Key Insights from Best Pro Trade
November 14, 2024
NinjaTrader New Ecosystem Tools: October 2024 Edition
Enter Email for Updates