E-Mini Tutor offers three 1 on 1 Day Trading Education options aimed at traders who are interested in understanding the markets. The Pivot based trading methodologies strive to forecast market moves before they occur empowering traders to work smart, not hard. Enroll today!
Explore the vibrant world of NinjaTrader 8 Add Ons – a treasure trove of powerful tools crafted to elevate your trading game. Dive into an array of clocks, indicators and utilities designed to amplify your market analysis, fine-tune strategies and execute trades with precision.
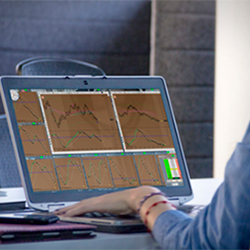
The Viper Pro Ultimate Trading Room is open for the first two hours of each trading day - Monday through Friday. Each morning, literally hundreds of traders from all over the US and throughout the world actively participate in these live market trading sessions. Live trade calls are made on as many as nine futures instruments.
Whether you are an absolute beginner, or an advanced trader, this course if for you. The Professional Trading Course is a comprehensive training program or serious traders consisting of 22 video lessons, a robust trading system plus ongoing support.
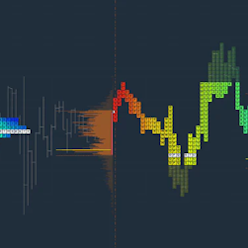
Futures Analytica's PolarityATI leverages market microstructure and order flow imbalances for automated trading. It features a dynamic machine learning module, offering traders a sophisticated and adaptable tool for market engagement, while eliminating any subjectivity in setup and configuration.
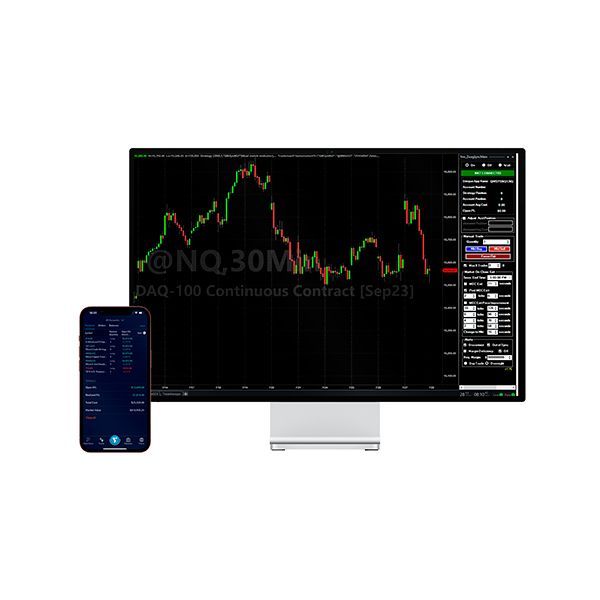
With these trader support plans you will have everything you need to carry out your operations in a professional way. They put at your disposal the latest technology on algorithmic trading. Proven software used by professional traders.
This innovative tool from candlestick guru, Steve Nison, instantly finds his favorite candle patterns on charts. The Nison Candle Scanner works on all asset classes. Traders save hours of research time, spotting candlestick pattern opportunities immediately. Choose a monthly or lifetime purchase!
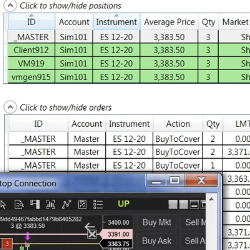
Replicate orders and manage positions from a master NinjaTrader instance to one or multiple NinjaTrader slaves.
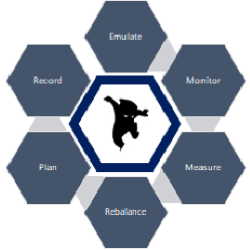
The Tradelytics platform enables investors, wealth managers and analysts to emulate and execute portfolio management with the live market data for both simulated and live portfolios. The portfolio is measured for risk and reward. Users anywhere can record fundamental and technical analyses.
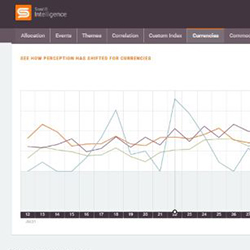
Sentifi's crypto sentiment analytics detect sentiment shifts in real time from over 500 million tweets and 2 million news and blog articles published worldwide every day. Sentifi mines this vast pool of data for investment insights to inform how market momentum is shifting ahead of price movements.
December 2, 2024
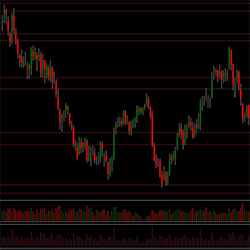
Mastering Sideways Markets With Auction Bars and Range Projections
November 19, 2024
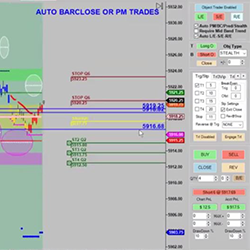
Enhancing Your Automated Trading System: Key Insights from Best Pro Trade
November 14, 2024
NinjaTrader New Ecosystem Tools: October 2024 Edition
Enter Email for Updates