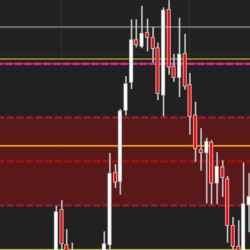
The “opening range” is the range obtained from the highest and lowest price of a security during the first minutes of daily trading activity. The JATS Opening Range Indicator displays the OR and the current open of the RTH session for a defined time period, as well as the pre-session Globex.
AITrendPredictor™ predicts price direction movement for the next 24 hours based on an advanced AI model, and for each prediction it provides an accuracy percentage score. It works in conjunction with DataGrabber™, which is used to generate data that gets used in AITrendPredictor™.
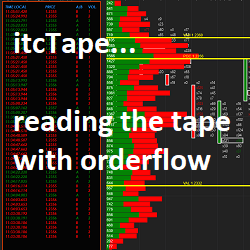
itcTape is a powerful indicator to read the tape & find precise entries in the market. Tape reading is used to follow institutional moves & go along with them. It is used by scalpers as well as by swing traders. The itcTape indicator is highly customizable by size, colors, filter & more.
We provide an all-in-one fully-featured automated trading strategy ready to trade any market (Futures, Stocks, Forex). We deliver the utmost reliability and frequently release new features free of charge. Schedule your FREE demo today and see how our members have boosted their trading performances.
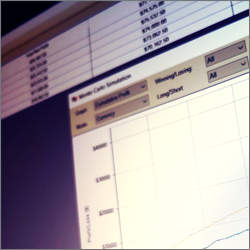
Use the experience of a quantitative trading system professional to help design, test, improve or optimize your trading strategy. Get a complete system analysis to have the confidence that your strategy performs exactly how it was designed to.
Our Dedicated Programmer service is ideal for medium and long-term projects. If you need continuous software development, we recommend a dedicated programmer solution. A personal programmer will address all of your requirements at a reasonable monthly rate.
Pattern MNTrader is a fully automated trading system. Trading is conducted based on trading patterns, support and resistance lines, Fibonacci lines and trend lines. This unique combination of tools creates an innovative system of support positions with flexible settings.
Market Analyzer Column: Effortlessly tailor real-time market data to your needs.
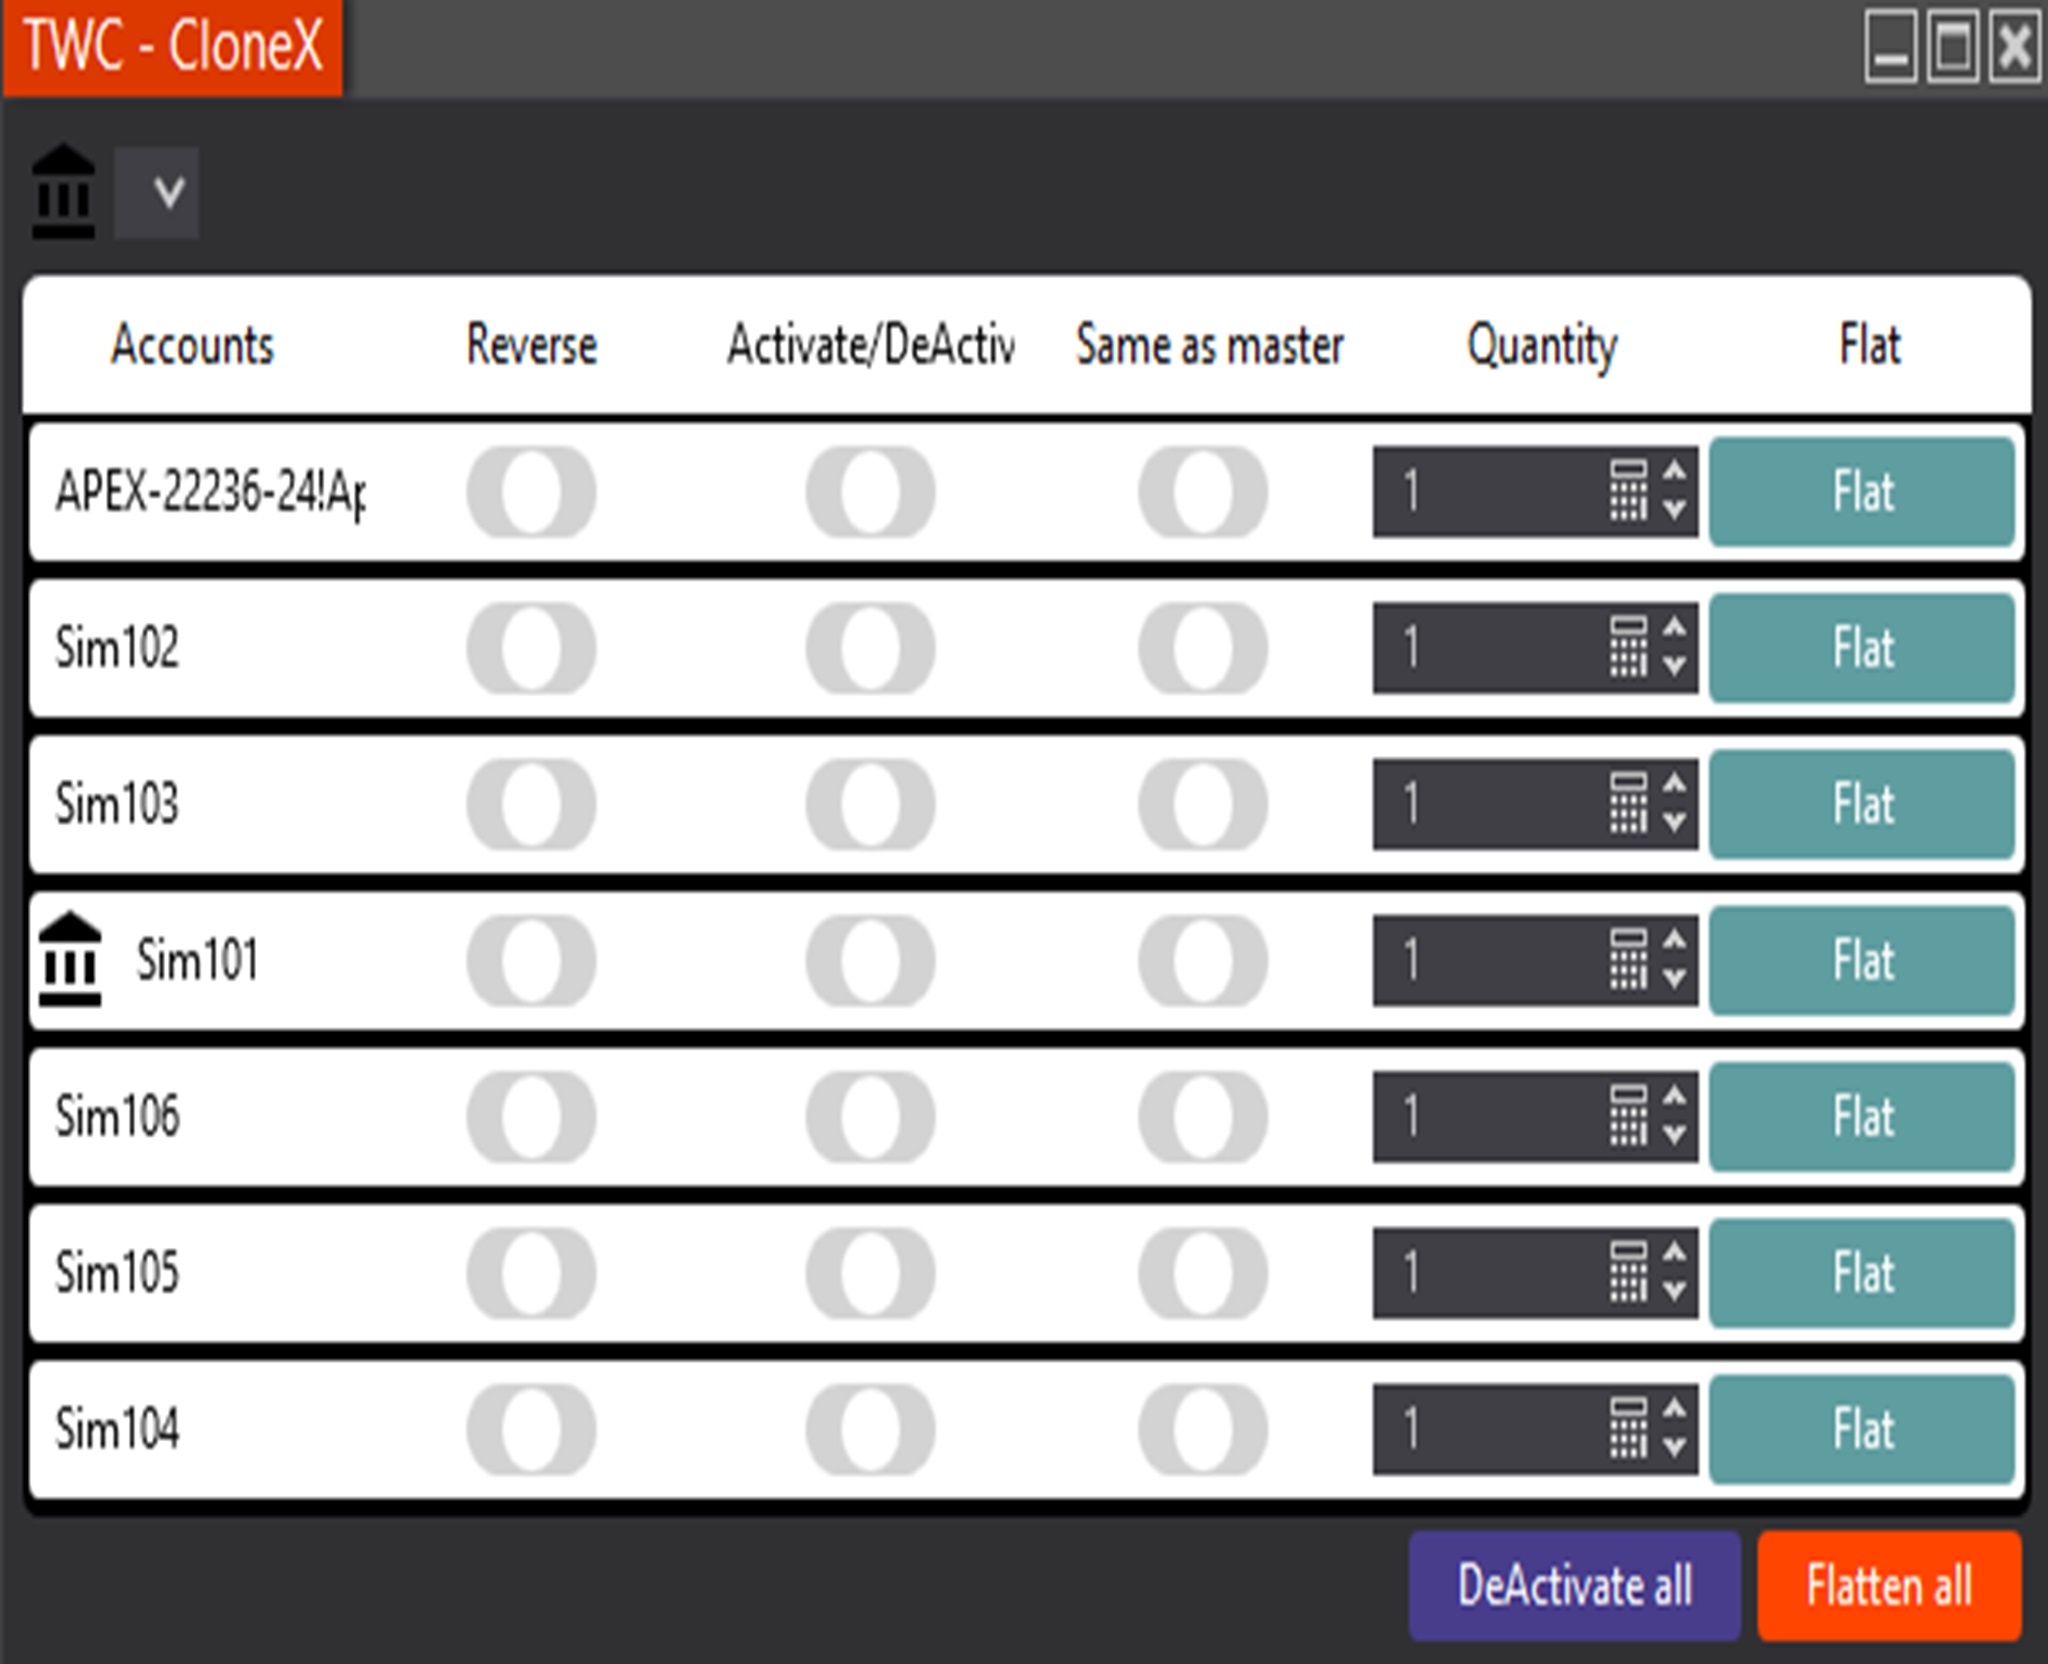
Introducing the advanced Trade Copier, a sophisticated solution for seamless copy trading. This digital product enables efficient trade copying from a master account to all connected accounts, ensuring uniform execution across your trading network.
A slow but efficient robot for NinjaTrader 8. It only works on NASDAQ. Take-profit at 13 ticks; stop-loss at 18 ticks. If you want, you can change the take-profit and stop-loss settings.
December 2, 2024
Mastering Sideways Markets With Auction Bars and Range Projections
November 19, 2024
Enhancing Your Automated Trading System: Key Insights from Best Pro Trade
November 14, 2024
NinjaTrader New Ecosystem Tools: October 2024 Edition
Enter Email for Updates