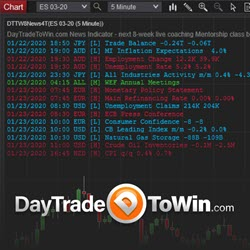
Download our FREE news indicator to see upcoming/scheduled financial news events plotted right on your chart. News events can cause sudden volatility and losing trades. Use this tool to stay informed. Watch the "Trading the News" video: https://daytradetowin.com/educational-trading-videos
The indicator is compatible with any oscillator, utilizing NinjaScript signals for Market Analyzer, facilitating efficient scanning of numerous instruments simultaneously. The advanced "Lookback" feature enhances precision by allowing customization for swing points and divergence patterns.
This course is designed to get you up and running with strategy design and coding for NinjaTrader 8. It provides the most efficient framework that you can adapt for the architecture of most systems and demonstrates various ways to enter and exit the market using the most standard techniques.
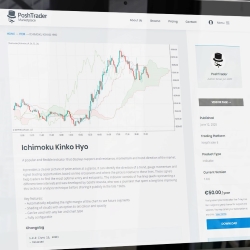
PoshTrader is a fintech company based in Estonia that specializes in custom development and out-of-box solutions for traders. We convert, retain and increase the lifetime value of trading platforms. Our work focuses on enhancing the trader's experience and performance.
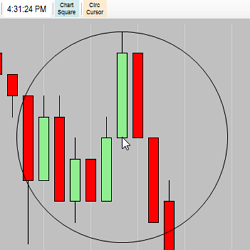
Need a quick way to measure X ticks from the cursor, for free? The IT_CircCursor is just that type of bare bones tool. Set the ticks in the parameters and click the toolbar button to activate. There are many free indicators to choose from, visit Integrity Traders today to learn more!
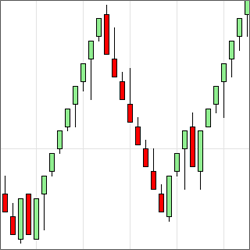
The Lucrum Vision Renko Bar reflects the actual price of the underlying instrument so you can be confident in its ability to accurately represent true price. Get accurate Renko charting for both live and backtested trading environments.
The Session Delta Pivot monitors the aggressive auction participants within a given session. By mapping this type of activity, the user can gauge the potential location for initiative activity as well as develop an understanding of directional day types.
The Line Break Bar is one of the most effective ways to reduce chart noise. It provides accurate back-testing results by showing the correct open prices and restoring the wicks. Easily recognize divergence & price action patterns & eliminate noise from traditional minute charts. Get started today!
Get precious info to start your trading week! Focused 100% in E-mini S&P500 Futures and based in a mix of technical analysis with order flow tools, the newsletter presents possible trading scenarios for the week, highlighting important regions. Sign up now for FREE!
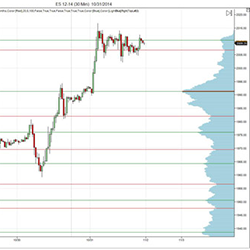
A1VolumeProfile is an easy way to add intraday and composite volume profiles to any chart. High and low volume nodes can indicate high probability areas for price predictability, and value areas indicate high probability areas for potential intra-day trend changes. Download a free trial!
December 2, 2024
Mastering Sideways Markets With Auction Bars and Range Projections
November 19, 2024
Enhancing Your Automated Trading System: Key Insights from Best Pro Trade
November 14, 2024
NinjaTrader New Ecosystem Tools: October 2024 Edition
Enter Email for Updates