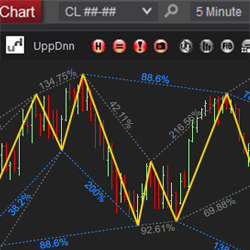
The Swing Toolkit is a collection of swing analysis tools designed to make trading faster and more consistent. Swing Pattern Trading utilizes the recognition of specific price patterns and the alignment of exact Fibonacci ratios to determine possible reversal points in the financial markets.
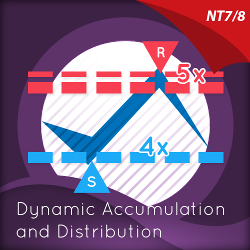
Dynamic Accumulation & Distribution plots graphically and numerically, how many times a price region has been tested. Levels tested more will appear as deeper lines, and levels tested less will appear as narrower lines, instantly revealing the depth of any accumulation or distribution region.
EdsRetracePlan with Markers Plus added is a simple to use single indicator system for Ninja 8. Using 3 to 5 range charts, you can automate CL, NQ and GC trade entries by turning on Markers Plus. Trades will be taken using the long or short signals generated by ERP and then managed by Ninja 8 ATM.
Advanced Wyckoff Course: Learn advanced concepts of the Wyckoff Method in a simple way. This will teach you unique concepts that will make you an expert in the Wyckoff methodology and take your analysis and trading to the next level.
Gain an edge over the competition with FX indicators that calculate the Stochastics, RSI, DMI, ADX, ATR, and Verticality of each currency! The Fibozachi Forex Force indicators tell you exactly which currencies are the strongest and weakest, and which pairs have the most favorable correlations!
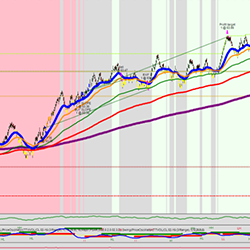
Next-generation support and resistance for active traders. Chartmap™ makes drawing lines on a chart a thing of the past by utilizing an innovative pattern finding algorithm to generate a heat map of powerful support and resistance. Upgrade your charts today with a 7-day free trial.
Know that you’re an amazing trader but finding the funds to get started is the one thing standing in your way? At UProfitTrader, we can help! Simply choose the size account you’d like, show us what you’ve got through our unique testing process, then start turning your passion into a profession.
A comprehensive Automated System including 20 strategies covering a broad range of instruments and market conditions. Includes indicators, color backgrounds, and a powerful money management module to protect profits and principal. Learn more.
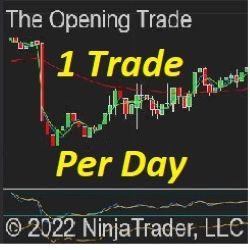
Signals are produced by an imbalance of prices between sessions, a principle of markets based in physics. You have the potential of 1 trade per day, automated from start to finish and designed to be monitored in some capacity. Users have full control of strategy parameters.
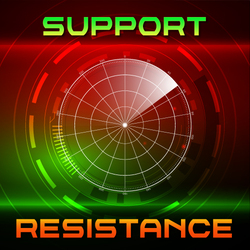
This is an excellent indicator in the S/R family. It was made with swing points, the visual concept of Market Profile, and their proprietary algorithm. The final result is a tool that can find outstanding S/R zones. It helps traders traverse the market, much like a radar helps a plane navigate.
December 2, 2024
Mastering Sideways Markets With Auction Bars and Range Projections
November 19, 2024
Enhancing Your Automated Trading System: Key Insights from Best Pro Trade
November 14, 2024
NinjaTrader New Ecosystem Tools: October 2024 Edition
Enter Email for Updates