HelloWin Backtest is a revolutionary trading analysis tool offering an intuitive PnL graph for real-time system evaluation. Supporting various bar types, slippage adjustments, and a unique two-round logic for defining entries, it mirrors the strategic approach of professional traders.
Educational program that teaches a unique blend of order flow strategies and a few proprietary concepts in a CPD-certified program.
GAP/VWAP Fail is one of Scott's favorite stock setups that can be also applied to futures. A frequent & highly favorable risk-reward play that finds an additional edge by understanding order flow, watch Scott explain it in detail & demonstrate with multiple examples including entry & exit rules.
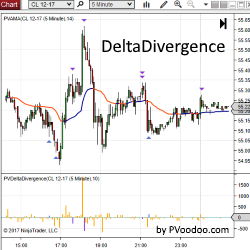
PVDeltaDivergence Indicator is a powerful tool designed to help traders identify possible turning points in their favorite markets with order flow analysis. Get a free trial of PVDeltaDivergence for NinjaTrader today!
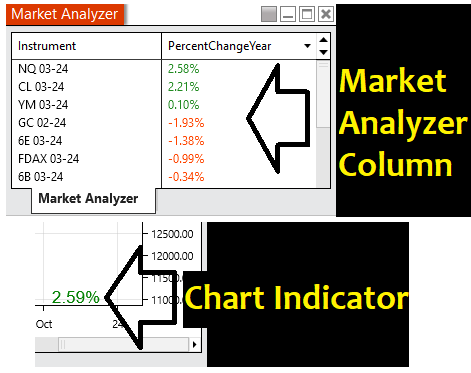
Easily display an instrument’s percent change on the year, on your market analyzer or chart. Works with stocks, futures or indices. Watch markets bounce off key figures like 8%, etc. Free Indicator.
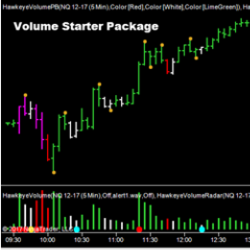
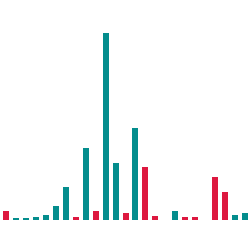
Hawkeye Starter Package is an immensely powerful leading indicator that performs over 300 calculations per bar to analyze the price action and associated volume, signaling price movement prior to it happening. Buy the Hawkeye Starter Package now at its affordable low price!
This savvy tool is for any intraday trader who draws lines and prizes accuracy when plotting, templating and reviewing line break information across multiple intraday timeframes. Our template tool also features the 5 standard next-gen and time saving features of the CT_Signature Fan Series.
Kase StatWare indicators are self-optimizing, and dynamically adjust to market volatility across multiple bar lengths. StatWare’s momentum based indicators identify trend direction and strength, precise entry and exit points, and optimal stop levels to control risk. Take a free 30-day trial today!
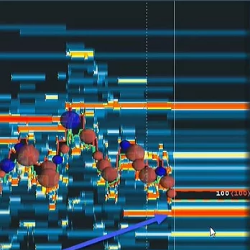
The MPace indicator shows the Velocity (speed) of the tape. It allows users to see the speed at which bids are being hit, and the speed at which offers are being lifted.
The Volatility Index (VIX) is a real-time market index that represents the market's expectation of 30-day forward-looking volatility. The VIX moves inversely to the indices and is often used as an indicator of upcoming market moves to time precise entries and exits. AKA Fear Gauge or Fear Index
December 2, 2024
Mastering Sideways Markets With Auction Bars and Range Projections
November 19, 2024
Enhancing Your Automated Trading System: Key Insights from Best Pro Trade
November 14, 2024
NinjaTrader New Ecosystem Tools: October 2024 Edition
Enter Email for Updates