You can download and try our best indicators for NinjaTrader 8 now! These indicators are free to try. 24-hour technical support and all future updates included. Watch video tutorials on indicator details and how to use them. Hurry! Click here to download and try now!
This indicator tracks the Smart Money flow in the market. Following the Smart Money provides a better understanding of the volatility size and trend direction. Ready to see what the Smart Money is doing?
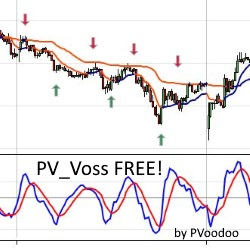
Try this FREE Voss Predictive Filter by John Ehlers & Henning U. Voss, with source code included by PVoodoo.com. Test it today for free!
Delta Polar Bars are a new Order Flow bar type built on polarity between delta and volume. They finely distinguish balance/imbalance zones and produce specific intra-bar delta patterns which help to identify reversal/trend continuation.
KingRenko$ is the real “face” of ninZaRenko. It has no artificial open and only real data, so you can see for sure the real OHLC of a KingRenko$ candle. As a result, KingRenko$ can be accurately backtested.
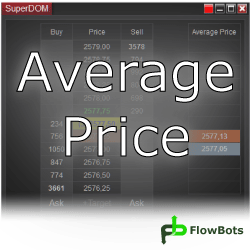
The SuperDOM Average Price Column shows a position average price accumulated since the first order execution. All opened and closed executions from the beginning of the position are used for the calculation. Save time by knowing your current position's average price for all of your past entries!
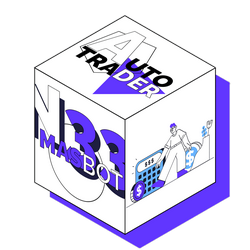
Experience the success of our automated trading strategy for yourself with a complimentary 14-day trial. The strategy is designed to recognize market reversals and make trades accordingly. The Auto-Trader is completely free to test during the trial period with full support and templates.
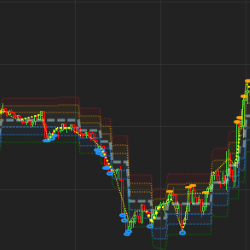
The Linear Regression Trend Lines Indicator dynamically balances the trend on your chart on all time frames. This indicator is built from several linear regression indicators and modified Keltner Channels. Set up to five offset multiplier levels for targets or reversals.
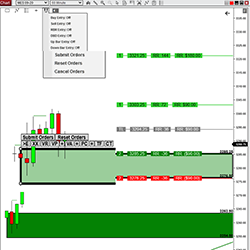
PFAHedger is an innovative addon to the PFAZoneSuite supply & demand indicator, providing the ability to submit hedging positions on any market. Simultaneously submit trades on any market while submitting hedge orders on another market, directly from the same chart.
This 25+ Chapter Price Action Course plus 4 one-on-one hour long help sessions are designed to address trading hurdles you may be facing. This Couse Includes access to VIP discord, daily morning livestream, lifetime access to the course, and more!
December 2, 2024
Mastering Sideways Markets With Auction Bars and Range Projections
November 19, 2024
Enhancing Your Automated Trading System: Key Insights from Best Pro Trade
November 14, 2024
NinjaTrader New Ecosystem Tools: October 2024 Edition
Enter Email for Updates