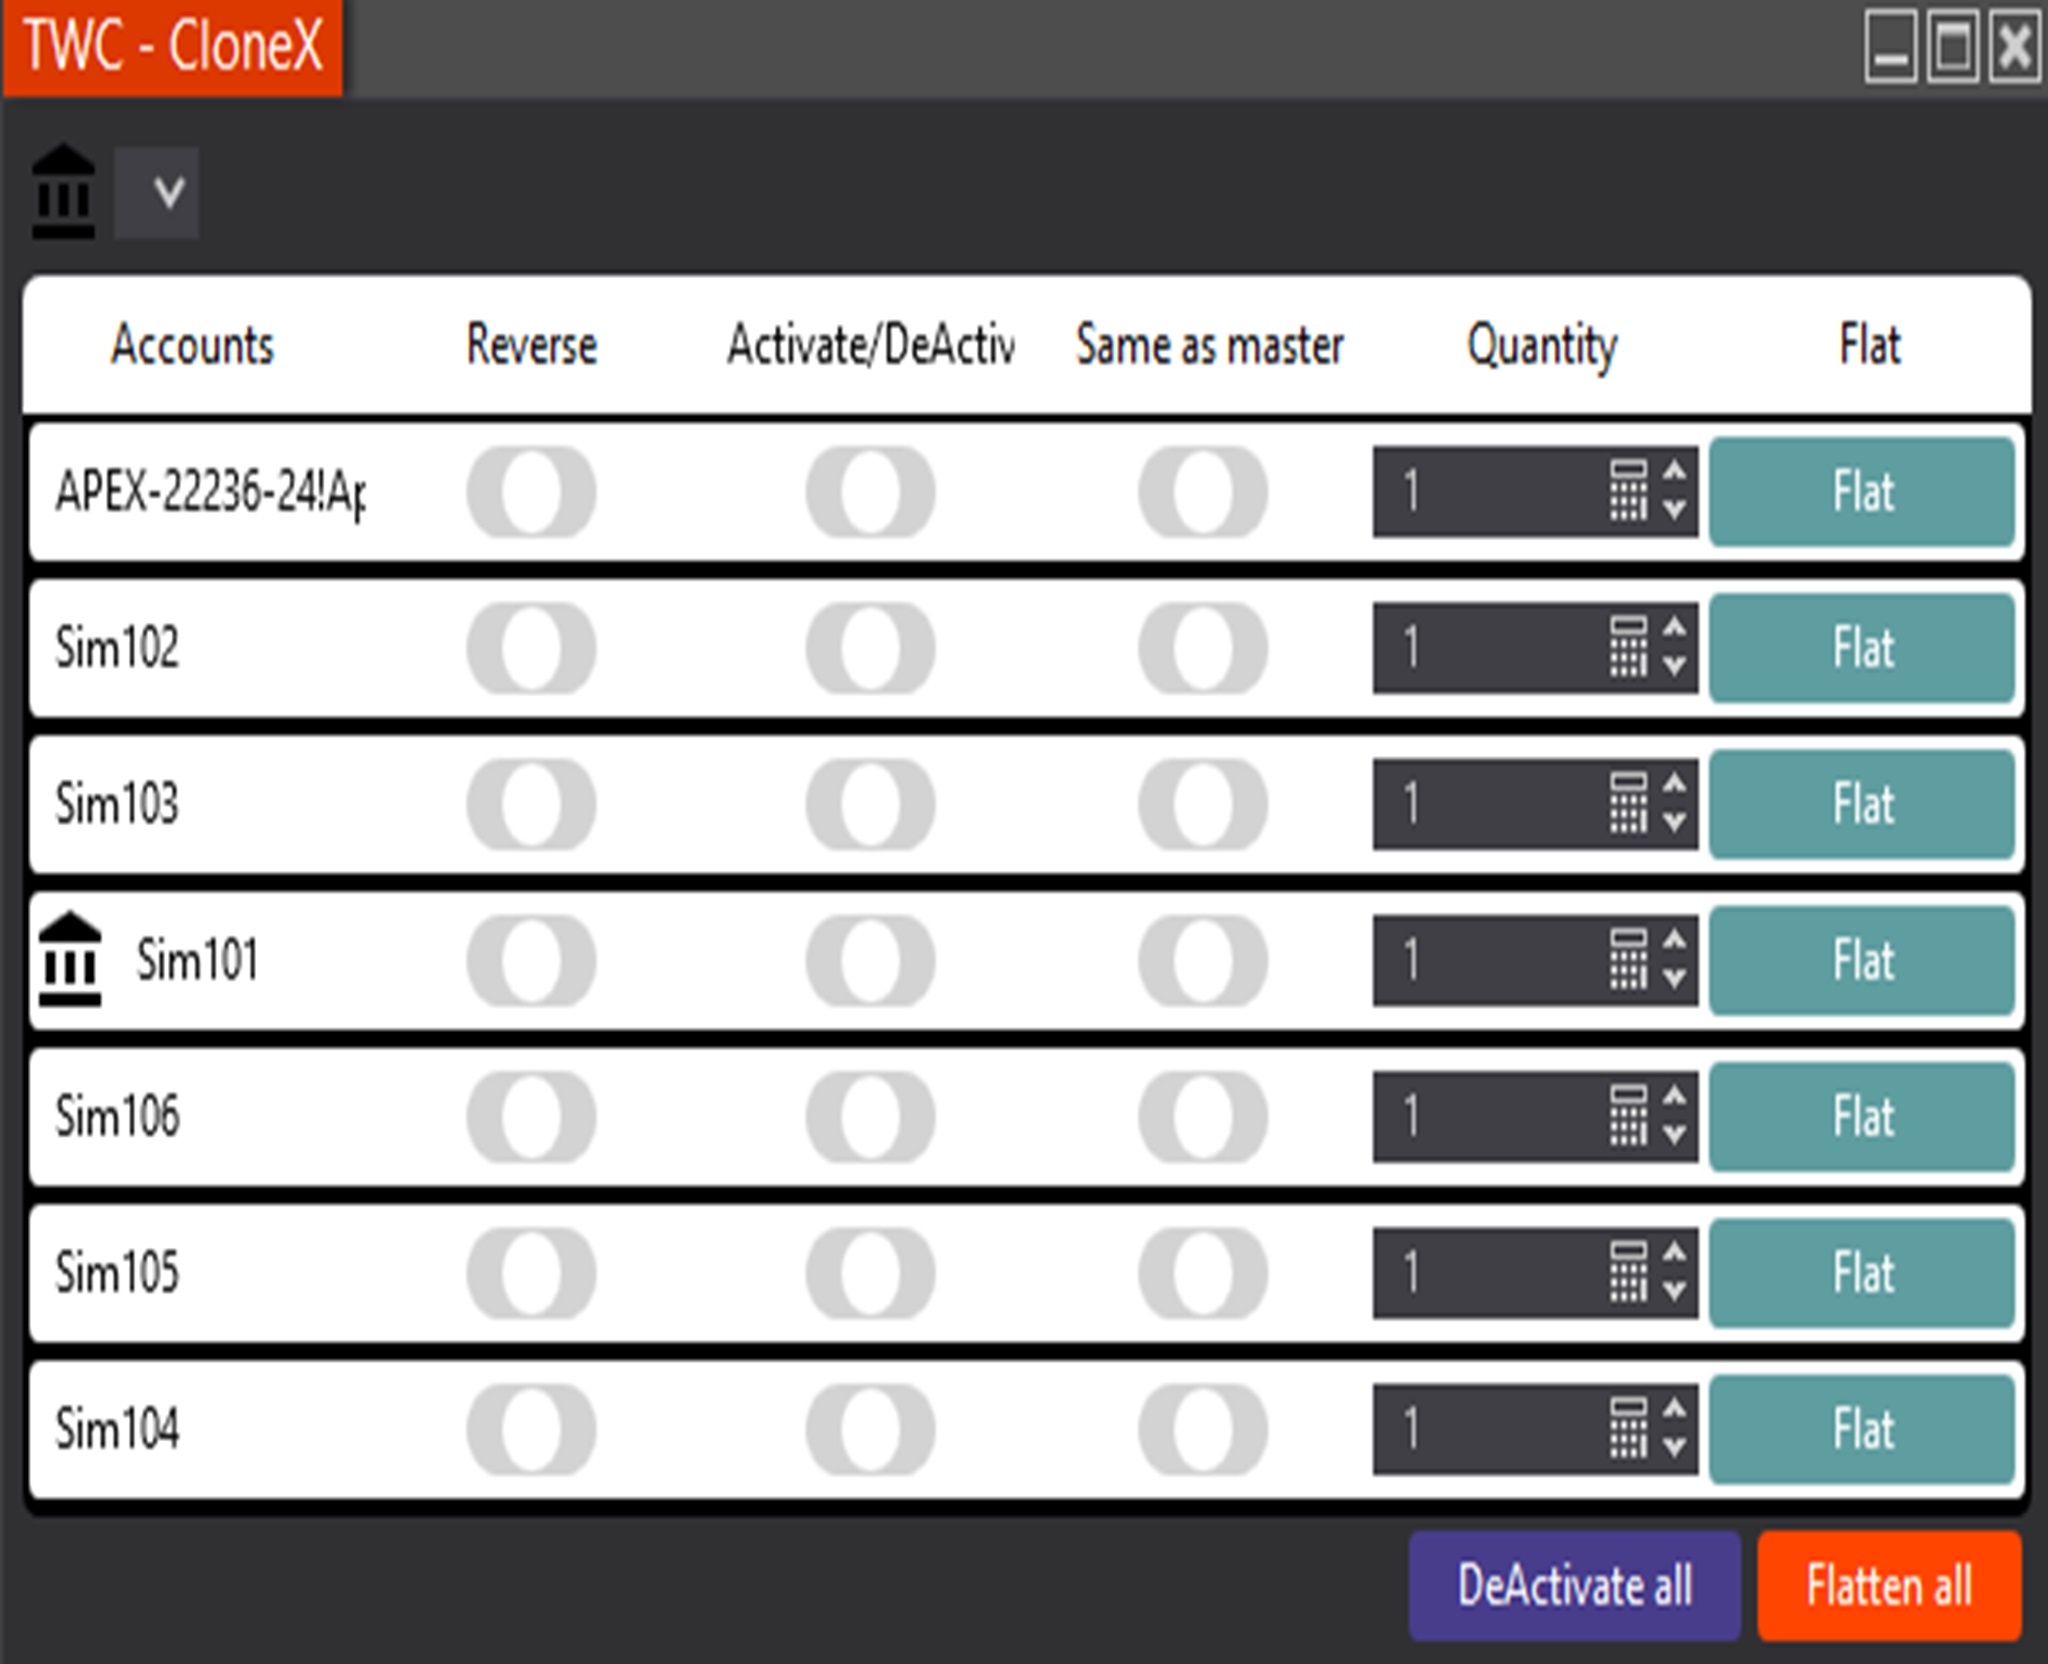
Introducing the advanced Trade Copier, a sophisticated solution for seamless copy trading. This digital product enables efficient trade copying from a master account to all connected accounts, ensuring uniform execution across your trading network.
David Misselhorn is a software developer with over 30 years of development experience in trading clients, market data and order-execution software. He writes indicators and strategies for individuals wishing to automate their trading and analysis activities.
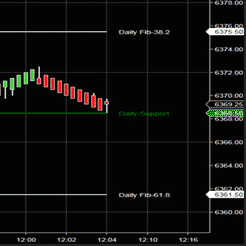
Trading123 Automatic Fibonacci Pivots draws the Fibonacci levels for you. No more second guessing as to where the price action is going. The Fibonacci levels move with the price action from one level to the next. Precise trading using price action for entries and exits at Fibonacci levels.
The FiReZ Trading Strategy is an original and modern refinement of Fibonacci technical analysis. This Fibonacci trading strategy may be the last strategy that you'll need to learn. Stop making trading complicated and learn how to analyze and trade in a simplified, structured, and repeatable system.
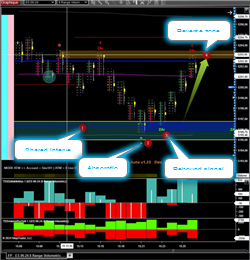
Quality: ✅ Created by Johnny, a developer and trader for his own trading. ✅ More than ten powerful signals clearly codified and documented. ✅ Automatic creation of algorithmic zones. ✅ Use possible even without knowing the footprint. ✅ No risk of the graph freezing due to the tickreplay mode.
The B.I.T.S (Breakout Intelligent Trading Signals) Indicator is designed around exclusive machine learning breakout technology for both swing trading and day trading stocks and futures on multiple timeframes.
The Oil Trading Room is a product of Robbins World Cup Champion Trader Rob Mitchell. It has a unique Scientific approach with Trading Signals, Indicator applications using Market Profile, Price Action, Order Flow, Momentum, Order Flow Momentum, Support Resistance, Market Mapping and more.
The Deep Signal Machine Learning uses machine learning to create optimized trade entries for automated trading. Traders can create machine learning models using their choice of indicator or instrument data. Visit DeepSignal.Tech for more information or get started with a two-week free trial today!
State-of-the-art NinjaTrader Bot and optimization models for futures retail traders. Designed for retail traders: This program is designed for retail traders seeking consistency on real accounts.
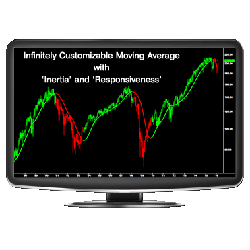
The ZMA™ is the most adaptable and customizable moving average indicator to date. By using an algorithm that incorporates the concepts of inertia, energy, and responsiveness, the ZMA is infinitely flexible and significantly more effective than other moving averages available.
December 2, 2024
Mastering Sideways Markets With Auction Bars and Range Projections
November 19, 2024
Enhancing Your Automated Trading System: Key Insights from Best Pro Trade
November 14, 2024
NinjaTrader New Ecosystem Tools: October 2024 Edition
Enter Email for Updates