This automated trading strategy for NinjaTrader 8 does not need any adjustment and is ready to be used out of the box. Newly created & designed for the Micro E-mini S&P 500 futures market, it has been thoroughly backtested over many weeks and is fully-functional.
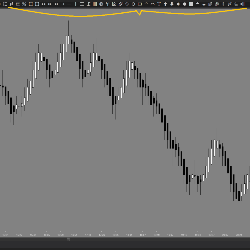
The Volatility Bands indicator attempts to present a way to measure and visualize volatility, using standard deviations (σ) and average true range indicator, and aims to point out areas that might indicate potential trading opportunities. Click to learn more.
The EPyFToolbar provides the capacity to execute many commands with a single click, such as enable/disable Chart Trader, hide all indicators from your chart, hide past trades, hide drawing objects, and more. Simply load the toolbar in one chart window and it will appear in every tab.
The CB Internals Panel shows you the breadth of the market long and short term. Combined with custom audio alert, it lets you know when the market is moving. It has been in development since 2016, and the current version stands alone.
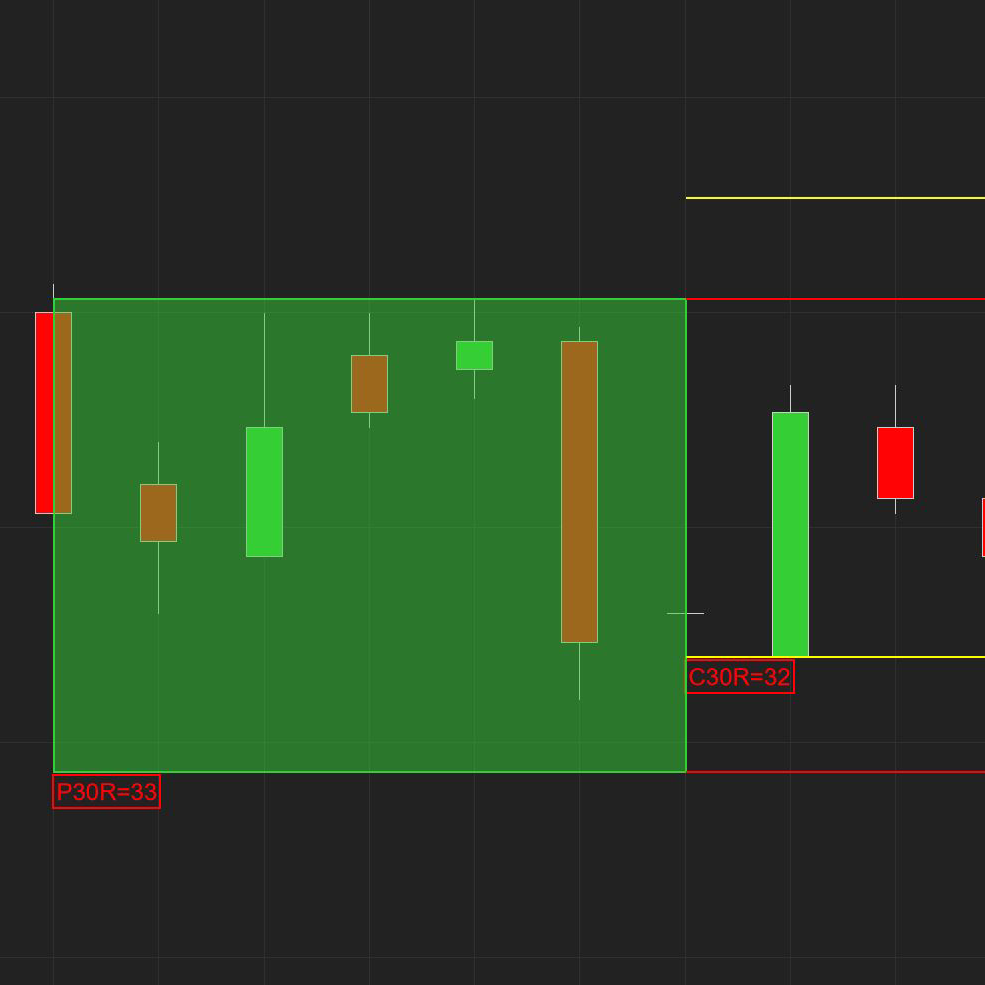
The purpose of the Free 30-Minute Range Indicator is to display visually the Previous 30-Minute Period and the Current 30-Minute Period's relationship to the previous period.
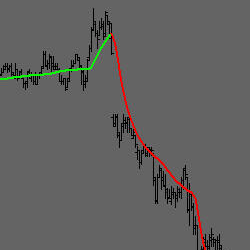
PLA Dynamical GOLD is a complex moving average that has 101 different speeds per length, overshoot true or false input, anti-reverse true or false input, and anti-reverse percentage adjustment. Also included is a fast start algorithm which requires only 10 bars of data to compute an output value.
Become a master of Nison Candle Scanner (NCS) with this next-level training. The step-by-step program enables traders to personalize NCS for their individual needs. Students learn to intelligently automate routines with advanced NCS tips, tricks, and strategies. Register for immediate access!
With a potential of 1 trade per day, this system is automated from start to finish & designed to be monitored in some capacity. If you can remotely access a computer with the right software, then you can monitor these automated trades from the golf course (with a strong cell signal).
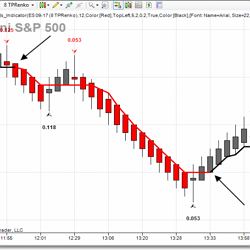
A simple 3-point system consisting of renko bars and two turning point trend indicators. The system is designed to enter trades late yet see positions through and avoid early exits. Includes fully automated strategy and indicator package. Free 30 day trials are available!
Elevate your trading with CyMo Pro, a dual-indicator system for eMicro and eMini Indices. The Cycle indicator identifies key price movements, while the Momentum indicator confirms trade readiness. CyMo Pro’s algorithms anticipate reversals and track trends up to three bars ahead.
December 2, 2024
Mastering Sideways Markets With Auction Bars and Range Projections
November 19, 2024
Enhancing Your Automated Trading System: Key Insights from Best Pro Trade
November 14, 2024
NinjaTrader New Ecosystem Tools: October 2024 Edition
Enter Email for Updates