Quickly identify your best trading metrics on a 100% cloud-based journal. Starting from 0 USD, keep your track record automated with Swiset. Register now!
Daily Levels plots important levels such as prior days open/high/low/mid/close, overnight high/low/mid, IB high/low and more! It also displays historical probabilities of price touching each level in regular and overnight sessions for the most popular futures products.
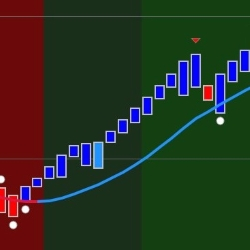
Channel VA MNTrader is a fully automated trading system. Trading is based on Renko strategy using a Keltner Channels indicator. The filtration system is based on the ADXVMA & the MACD indicator. It has an improved position support system with flexible settings that will improve trading consistency.
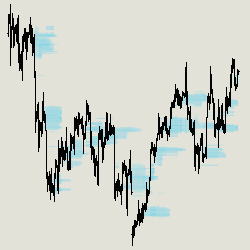
Dynamic Volume Profile is an optimized indicator which represents market profile with live and historical volume data. This strategy and backtest friendly indicator enables users to easily analyze years of historical data and adjust parameters dynamically from both the menu and chart.
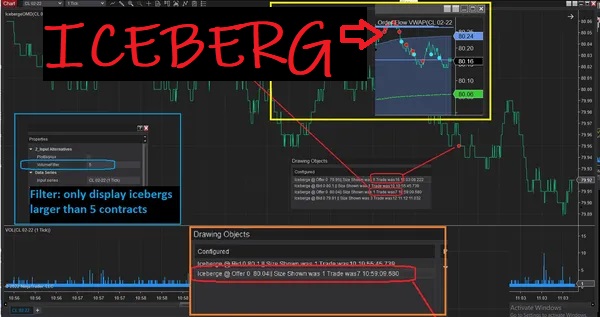
Detect sophisticated large traders, attempting to obfuscate their trading by only posting or displaying a portion of their order size. Indicator will highlight prices on a chart where iceberg was used and for how many contracts.
Trade like a pro with the proprietary Alpha Fibonacci System, traded globally by traders of all levels & instruments since 2011. The lifetime system includes Multi Market Scanners with group or private mentoring courses and a video library, modules and trading room included. [email protected]
The BoxB MNTrader strategy is a fully automated trading system. Trading is based on the strategy of breaking through the box when forming a certain length and height. This system has several options for filtering: EMA, RSI, Stochastic, Arun Oscillator or Vortex.
Track NYSE and NASDAQ market breadth divergence directly from your price chart - even on Renko bars! Optimal Breadth seamlessly integrates advance-decline internals with your price chart and plots three intraday divergence types: classic, hidden and micro. Never miss a signal again!
Never Miss a Trade. The only live trading room that runs by very sophisticated bots. Join the rom and copy the bots trades 24/7.
This is a basic but powerful email training course aimed at newbies who want to get started in the world of trading and need a solid base of knowledge to help them survive the early stages of this business and increase their chances of success.
December 2, 2024
Mastering Sideways Markets With Auction Bars and Range Projections
November 19, 2024
Enhancing Your Automated Trading System: Key Insights from Best Pro Trade
November 14, 2024
NinjaTrader New Ecosystem Tools: October 2024 Edition
Enter Email for Updates