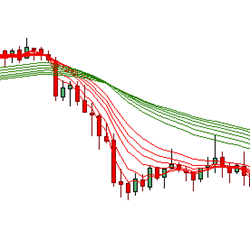
The Fanned Multiple Moving Average day trading indicator uses two sets of moving averages (long and short term) to calculate the probability of trend development, change, and direction. The FMMA reveals the nature of the trend and trend changes, which often reveals the starting point of a breakout.
Automatic ATM Entry Assistant (AUTOBOT) can be used with our indicators and others using native Ninjatrader 8 Arrows or Triangles on the chart. Set up complex entry parameters without coding. Continue to our product page to see the 25-minute video of how it works.
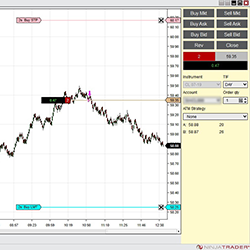
This robust pattern recognition strategy for day trading futures, stocks and FX has been used for Crude Oil futures trading since November 2017. It includes fully customizable parameters based on your individual risk tolerance level. Contact us to lease/purchase or explore synergistic opportunities.
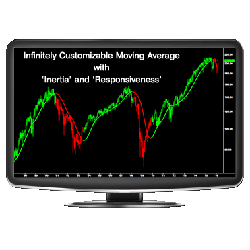
The ZMA™ is the most adaptable and customizable moving average indicator to date. By using an algorithm that incorporates the concepts of inertia, energy, and responsiveness, the ZMA is infinitely flexible and significantly more effective than other moving averages available.
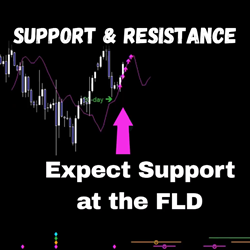
Perform an expert Hurst cycle analysis on any instrument/timeframe chart, and gain insight into hidden levels of support & resistance with accurate targets. Interactions between price & the Future Line of Demarcation (FLD) are identified for you, enabling anticipation of price action ahead of time.
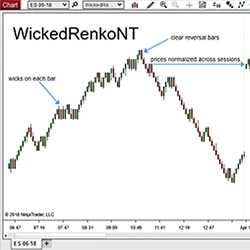
WickedRenkoNT is a custom Renko bar type which is easy to see & logical to interpret. Adding WickedRenkoNT bars to yourchart is extremely helpful in filtering noise on a chart, as well as identifying reversals. Additionally, these bars remove erroneous gaps and align bars across sessions.
The “opening range” is the range obtained from the highest and lowest price of a security during the first minutes of daily trading activity. The JATS Opening Range Indicator displays the OR and the current open of the RTH session for a defined time period, as well as the pre-session Globex.
The Easy E-mini E-book package details specific trade setups using standard indicators that are available with every download of NinjaTrader. The package comes pre-designed workspaces and templates, unlimited video library access & a 3-day chat room trial!
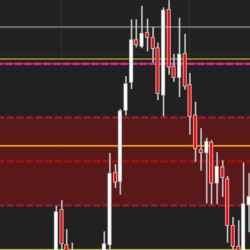
Identify market inefficiencies by marking fair value gaps (FVGs) on the chart that meet predefined size criteria. The indicator distinguishes between bullish and bearish gaps and changes their color once they are inversed. It provides clear visual cues for potential rejection trades from these gaps.
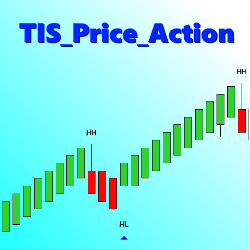
The TIS_Price_Action indicator detects and ranks pivots, then looks for a user specified sequence, such as Highest Low followed by Highest High to paint a long signal. Users can trigger 1 to 3 pivots to trigger a signal.
December 2, 2024
Mastering Sideways Markets With Auction Bars and Range Projections
November 19, 2024
Enhancing Your Automated Trading System: Key Insights from Best Pro Trade
November 14, 2024
NinjaTrader New Ecosystem Tools: October 2024 Edition
Enter Email for Updates