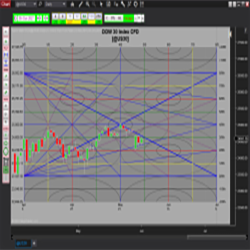
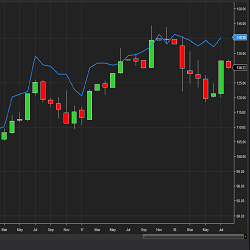
Samri Math Price-in-Time is a comprehensive tool for traders using Murrey Math methodology. This indicator calculates not just PRICE levels, but also sets the price in TIME. Easily switch between time frames (day or minute only) with the user-friendly interface.
Gorilla Futures offers a complete FootPrint indicator. This indicator works on all NinjaTrader 8 licenses. FootPrint Pro™ is 100% customizable and can identify and alert traders to imbalances, delta signals, volume, and more.
TSR Trading Guides contain 10 PDF ebooks compiled with the top articles from Trading Setups Review. Topics include price action, indicators, volume, swing trading, risk management, and trading philosophy. Pay what you want for this fantastic series of trading guides!
This indicator allows the user to copy-paste in one button, increasing application functionality and user charting efficiency.
The StockCalcValuation indicator displays a fundamental valuation for the company you are examining. At StockCalc we value 8000 companies each night using 6 valuation models or data points and determine a Weighted Average Valuation from these calculations for display. Get your free trial now!
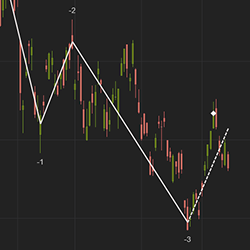
The Wave indicator is similar to an Elliot Wave with an added capability to forecast a possible market reversal. It has convenient features including the ability to number waves to help identify trend direction.
The Volume Vector tool creates automatic volume profiling of price action swings. Increase trading consistency and see exactly where trades have been initiated!
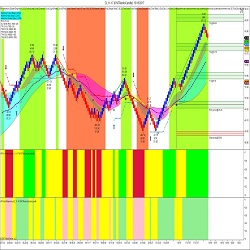
The HTS Master 2.0 is a trading solution that incorporates volatility and order flow to generate automated signals for scalping and trend following. The HTS commitment includes unlimited trading room access, private mentoring, & unlimited upgrades. Trade in Harmony now with a 2-week free trial.
The Exhaustion Absorption Detector, which is based on live time and sales data, is designed to display order activity between the bid and offers at market price.
Track volume profile in three timescales easily! Optimal Vision analyses point of control and value area breakouts in three rolling lookback periods of your choice and color-codes your bars by strength of signal. A simple way to bring dynamic volume profile to your trading! Strategy compatible.
December 2, 2024
Mastering Sideways Markets With Auction Bars and Range Projections
November 19, 2024
Enhancing Your Automated Trading System: Key Insights from Best Pro Trade
November 14, 2024
NinjaTrader New Ecosystem Tools: October 2024 Edition
Enter Email for Updates