Don't miss any more targets by a few ticks with Target Zone!
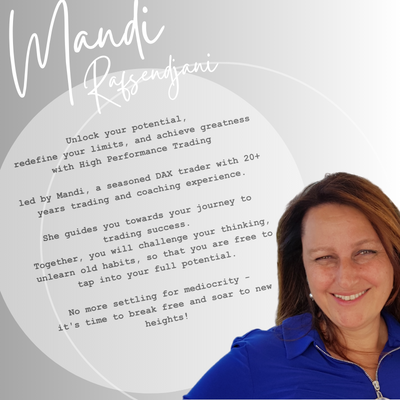
With decades experience as an active trader & accredited coach, Mandi understands what it takes to build a successful trading career. She specializes in coaching HedgeFund, Prop, Bank & Private Traders around the globe in the essential mindset aspects of trading.
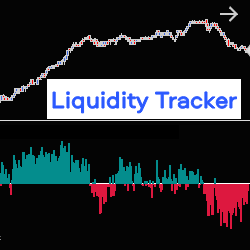
The Liquidity Tracker allows you to monitor, in real time, liquidity variations in the Order Book (pending orders at Bid & Ask), on one or two correlated instruments, at the same time. It therefore allows you to follow the evolution of the market based on the strength of supply or demand.
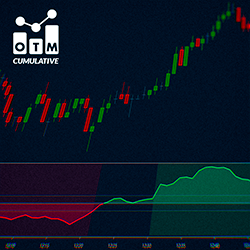
OTM Delta Cumulative is a histogram displaying delta behavior, measuring buying or selling strength. It helps identify trend transitions and clear trends. The curve direction shows the pressure difference between buyers and sellers, aiding informed market decisions.
The Epic U-Turn indicator is based on volume & previous price action to confirm that power has switched from buyers to sellers. For intraday or swing trading, these are also known as reversal bars, turnaround bars or engulfing reversal patterns. Strategy supports algo-trading. Download a free trial!
This robust pattern recognition strategy for day trading futures, stocks and FX has been used for Crude Oil futures trading since November 2017. It includes fully customizable parameters based on your individual risk tolerance level. Contact us to lease/purchase or explore synergistic opportunities.
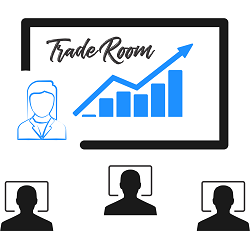
Experience first-hand how Touch Zone Trading identifies opportunities & manages trades. Whether you’re trading part-time or full, you’ve got to be ‘in the zone’ to perform. Are you a good fit for the Touch Zone Trade Room? Take the trader survey!
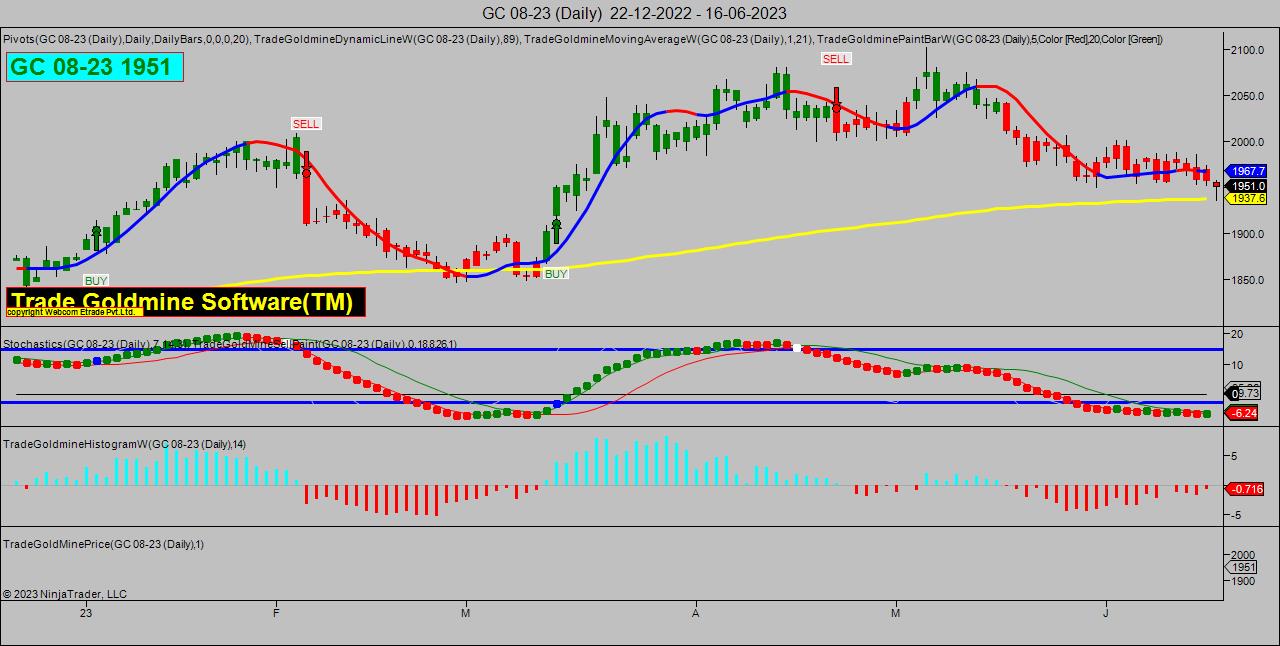
GOLDMINE NINJA TECHNIQUE software is a technical analysis tool that gives user-friendly BUY-SELL signals to traders and helps find perfect resistance & support levels in order to trade more effectively.
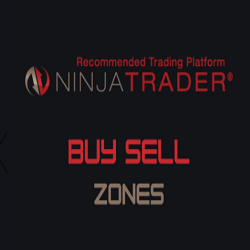
The Buy/Sell Zones are an adaptive approach to expansion and contraction within market rotations. Each rotation provides an area of interest for either the bid or offer, where they need to engage in order to protect the possibility of further extension. This approach allows you to trade with trend.
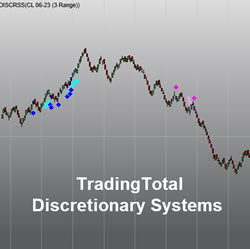
TradingTotal Discretionary Systems replicates several popular TradingTotal automated strategies entry rules for manual trading modality for future instruments.
December 2, 2024
Mastering Sideways Markets With Auction Bars and Range Projections
November 19, 2024
Enhancing Your Automated Trading System: Key Insights from Best Pro Trade
November 14, 2024
NinjaTrader New Ecosystem Tools: October 2024 Edition
Enter Email for Updates