The system looks for the highest high and lowest low over past bars, then the system tags the entry with a line that is proportional to your entry settings. Then the strategy calculates: Imbalance, velocity, momentum and probability.
iCinDER™ Cycles indicators provide traders with the basic 3 iCinDER Cycles, Minor, Intermediate and Major. The indicators provide overbought/oversold visualization as well as visualization of bullish and bearish bias. The analysis is based on cycles of the instrument being analyzed.
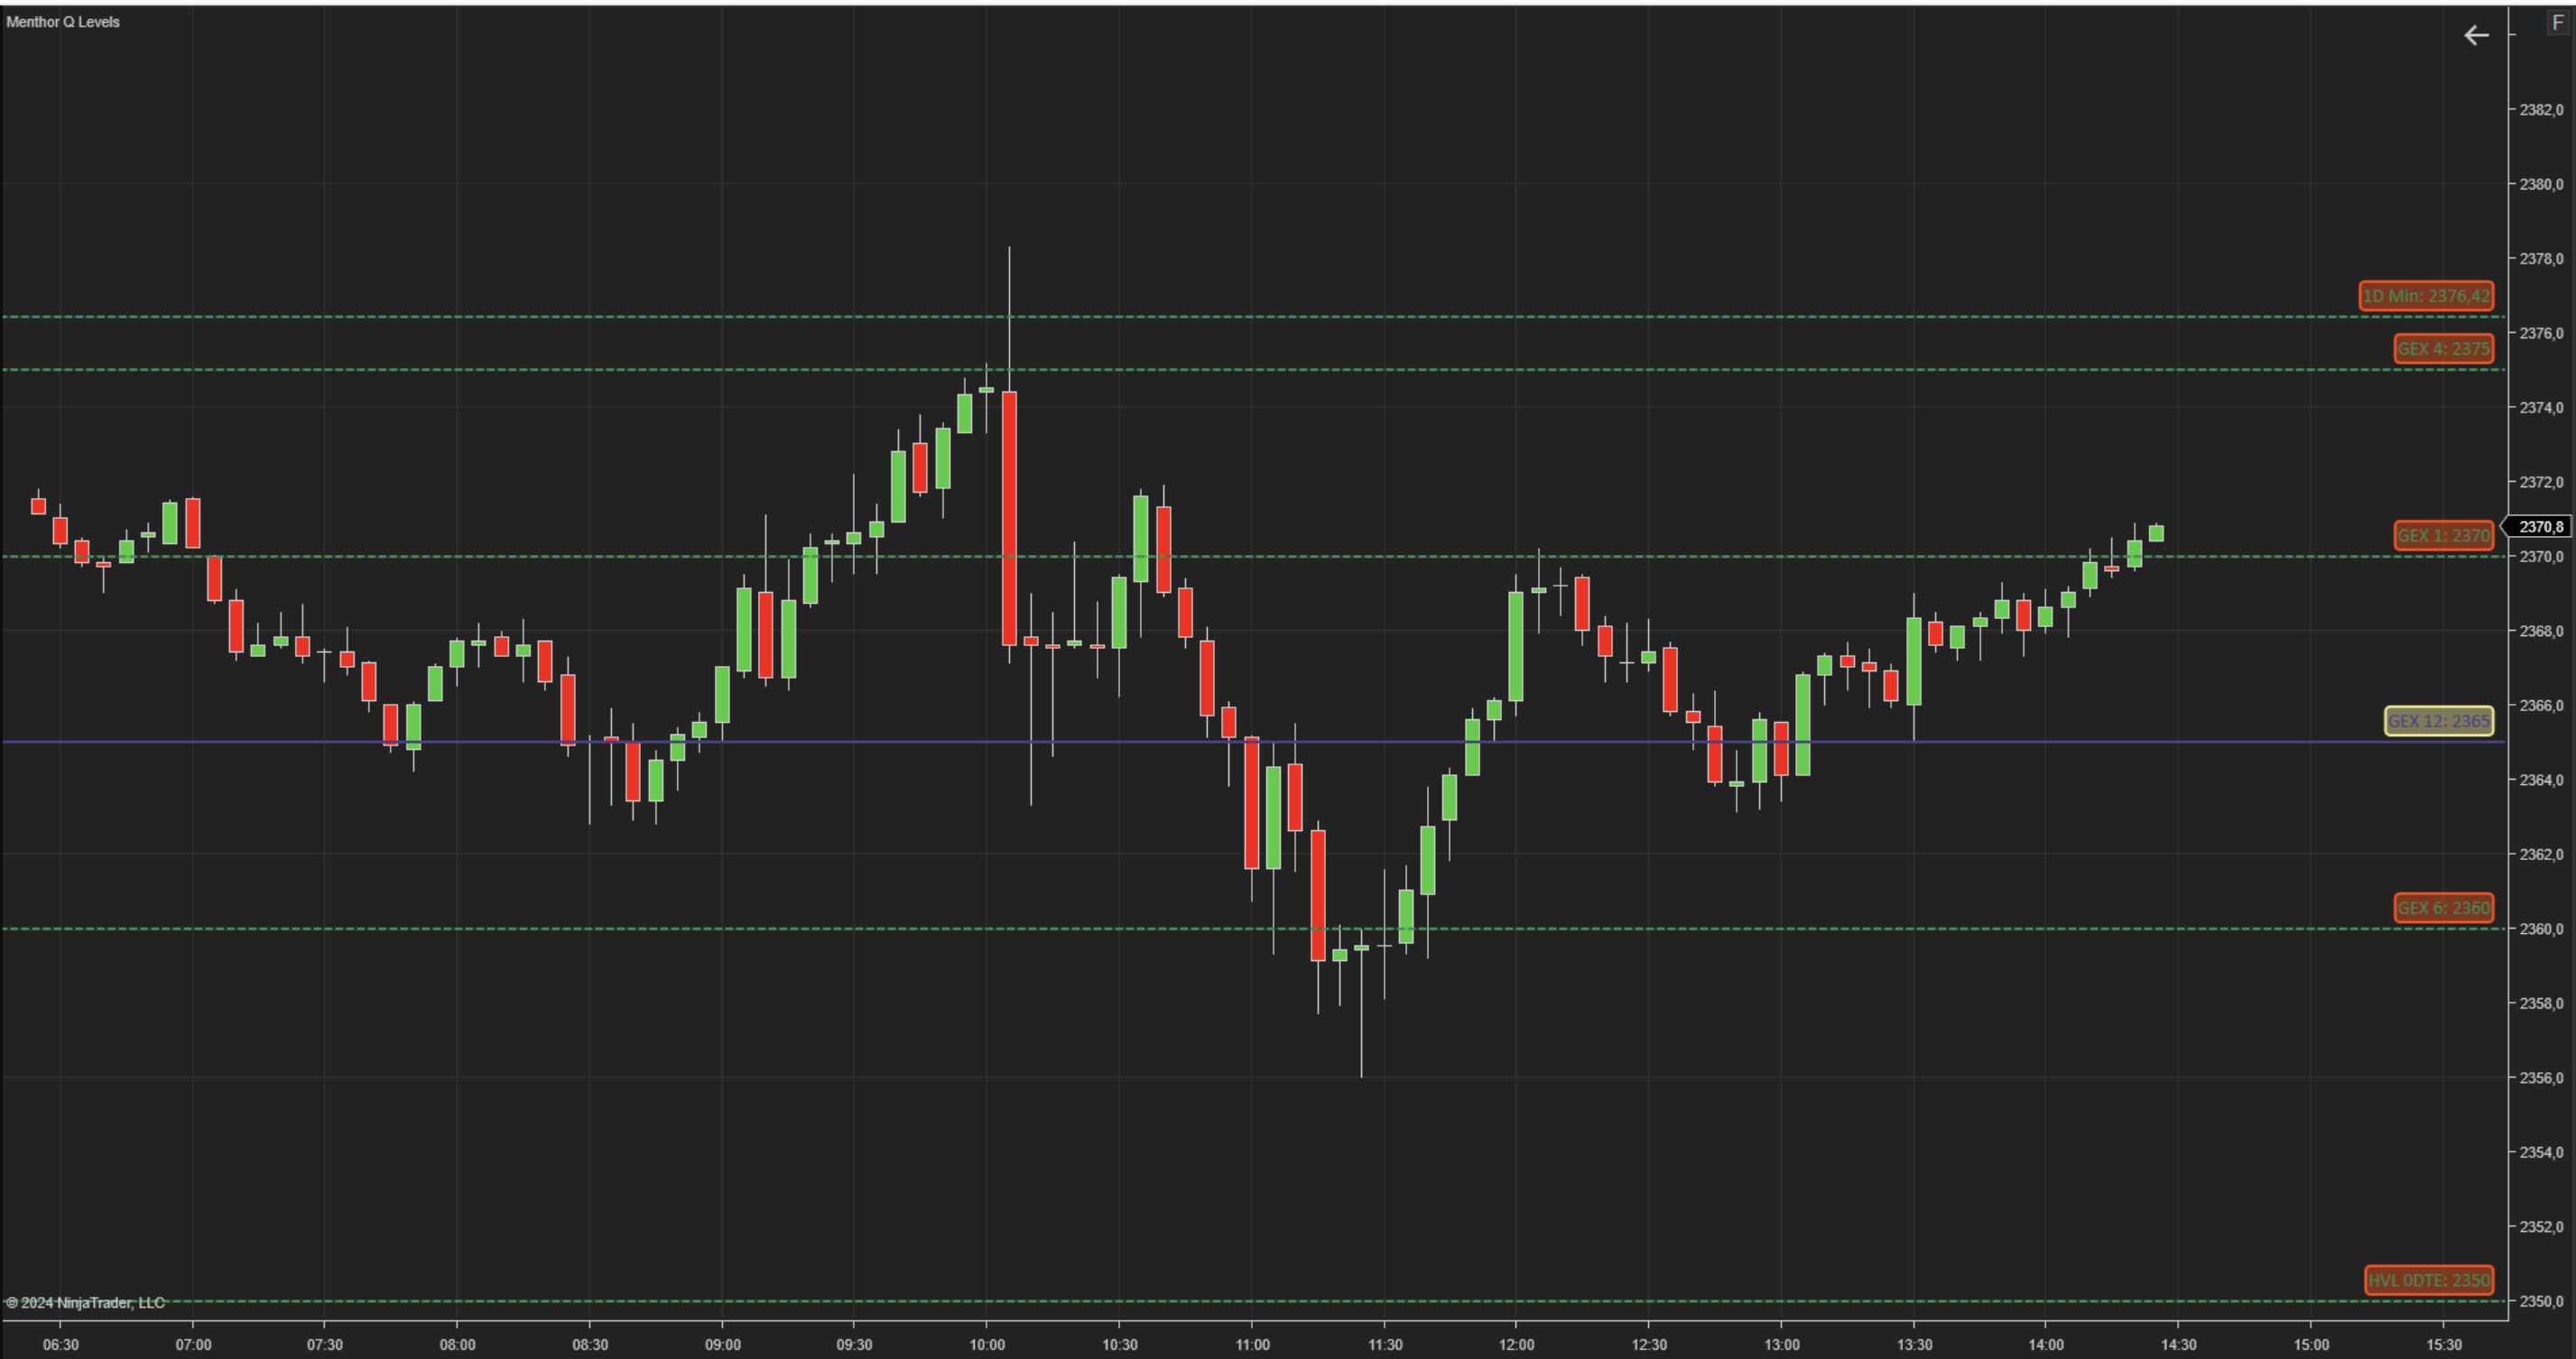
The Menthor Q-Levels indicator for NinjaTrader revolutionizes trading by deriving key levels and market reaction zones directly from options data. Seamlessly integrated into your chart, this innovative tool provides traders with precise and actionable levels that enhance decision-making.
It is not always easy to quickly determine the size of a bar by looking at the price axis. BarSizeCounter allows you to instantly observe the size of the bar and how far the current price is from its high and its low.
What a lovely day yesterday was! Do you ever wonder if there were similar days in the history of a trading instrument, and what happened thereafter? With the Similar Days Project, view price scenarios for 24 different currency pairs. This technology is scalable on any market.
This course is designed to get you up and running with strategy design and coding for NinjaTrader 8. It provides the most efficient framework that you can adapt for the architecture of most systems and demonstrates various ways to enter and exit the market using the most standard techniques.
Elevate your trading with CyMo Pro, a dual-indicator system for eMicro and eMini Indices. The Cycle indicator identifies key price movements, while the Momentum indicator confirms trade readiness. CyMo Pro’s algorithms anticipate reversals and track trends up to three bars ahead.
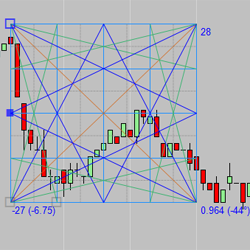
The IT_GannBox tool is fully loaded for chart analysis price prediction. This tool has all types of visual features and three modes of operation. Industry standard Fixed Ratio and FreeForm modes plus the custom FreeForm Ratio mode. Adding the IT_ChartSquare tool will allow visually accurate angles.
Manage your risk by setting drawdown limits and goals! If your drawdown limits are hit, the system prevents you from trading further. If your goal is hit, you can trade but never giving back more than your set amount. If hit, you're done for the day/week. This is your preset Dynamic Drawdown Limit.
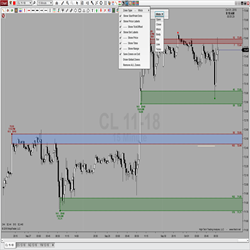
Creating, displaying & saving levels of interest could not be easier! Simply double click above or below any bar to automatically add or remove zones. This features 8 unique Zone Types, a right click context menu & toolbar icon for simple configuration, and is global drawing & template capable!
December 2, 2024
Mastering Sideways Markets With Auction Bars and Range Projections
November 19, 2024
Enhancing Your Automated Trading System: Key Insights from Best Pro Trade
November 14, 2024
NinjaTrader New Ecosystem Tools: October 2024 Edition
Enter Email for Updates